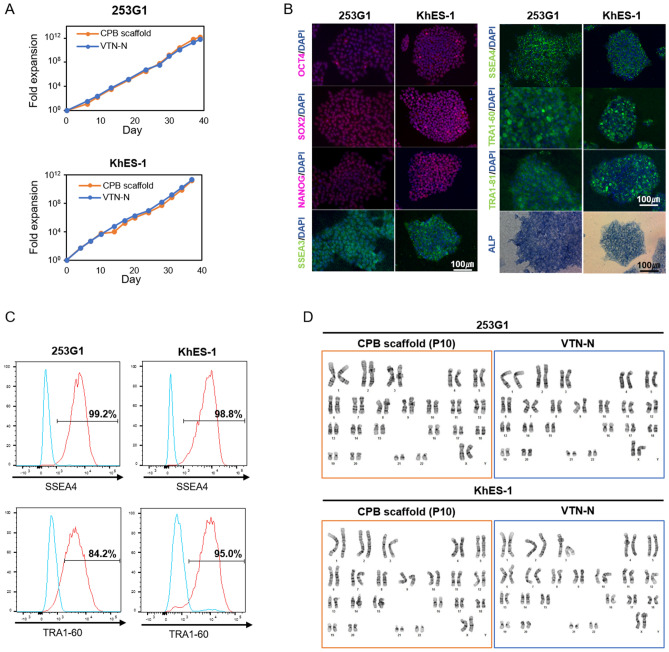
Figure 6.
Characterization of human induced pluripotent stem cells and human embryonic stem cells after long-term culture on CPB scaffold. (A) Comparison of fold expansion rates of the 253G1 and KhES-1 cell lines on CPB scaffold or VTN-N in Essential 8 medium. Fold expansion is shown in a one-logarithmic graph, and cell passages were performed more than 10 times. The orange circle on the graph shows the number of cells of 253G1 or KhES-1 cultured on CPB scaffold, and the blue circle shows the number of cells cultured on VTN-N. (B) Pluripotency marker immunostaining and alkaline phosphatase (ALP) expression analysis. Pluripotency markers are red or green. Nuclear staining is performed with DAPI and shown in blue. ALP is blue in bright field. The scale bar represents 100 µm. (C) FACS analysis of pluripotency marker-positive 253G1 and KhES-1 cells. Red and blue histograms show the stained and unstained control populations, respectively. At least 10,000 cells were measured for each sample. The vertical axis shows the mode standardized to 100. The percentage of marker-positive cells is indicated on each graph. (D) G-band karyotyping of the cells maintained on CPB scaffold or VTN-N. Using 253G1 cells or KhES-1 cells passaged 10 times or more on CPB scaffold or VTN-N, we observed normal chromosome numbers in 50 cells and performed karyotyping of 20 of them. A typical chromosomal image is shown.

