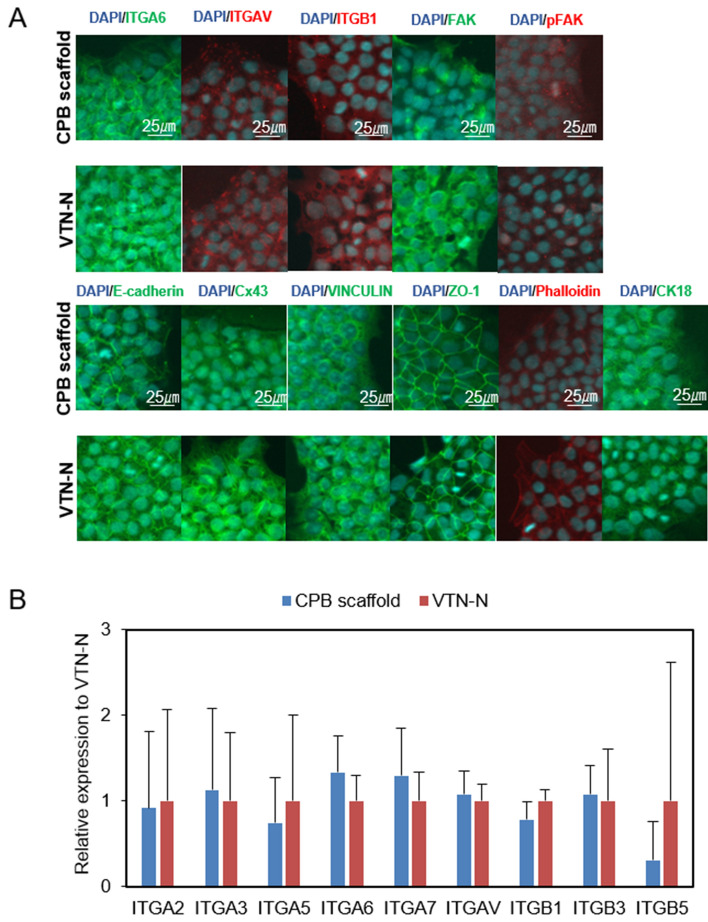
Figure 7.
Immunostaining and RT-qPCR of Integrin and other factors. (A) Immunofluorescent staining of integrins, focal adhesion molecules, and cytoskeleton proteins of 253G1 cells after more than 10 passages on CPB scaffold or VTN-N. Integrins and other factors are shown in green, red, or orange, and DAPI is shown in blue. Scale bars indicated in the figure. (B) Result of RT-qPCR of the relative gene expression of integrins normalized to expression on VTN-N. The vertical axis shows the fold change to VTN-N. Data are presented as mean ± SD of three independent experiments. (*P < 0.05 compared to VTN-N).

