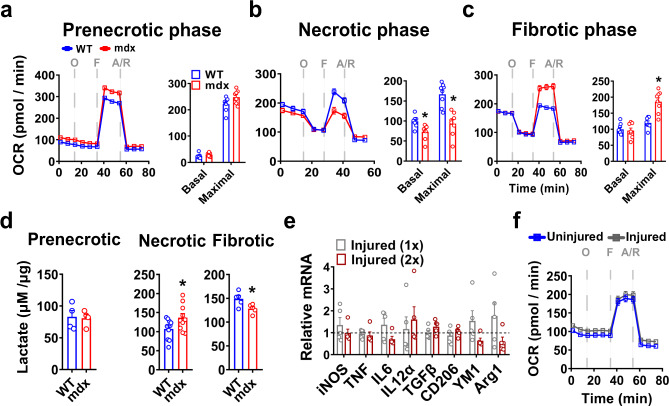
Fig. 2. Metabolic changes in mdx BMDM at different disease stages.
a–c Oxygen consumption rate (OCR) values after sequential treatment of BMDM with oligomycin (O), FCCP (F) and antimycin + rotenone (A/R) as measured by the Seahorse XF Analyzer at: a prenecrotic (n = 8/group), b necrotic (n = 8/group), and c fibrotic (n = 8/group) phases of disease. OCR values are normalized to cell count. d Lactate levels (normalized to µg of cell lysate protein) in supernatants from WT and mdx BMDM after incubating the cells for 48 h in phenol-red-free RPMI culture media (n = 4/group for prenecrotic, n = 10/group for necrotic, and n = 5/group for fibrotic). e mRNA transcript levels in BMDM (expressed relative to the mean uninjured level represented by the dashed line) obtained from WT mice after acute muscle injury (Injury 1x = injection of cardiotoxin into both tibialis anterior muscles with euthanasia 3 days later; Injury 2x = injection of cardiotoxin into tibialis anterior and gastrocnemius muscles on days 0 and 3, respectively, with euthanasia at day 13) (n = 5/group). f Representative OCR curve from Injury 1x group in e (n = 5/group). Data represent means ± SEM of biologically independent samples from different mice. *P < 0.05 vs. WT (unpaired t-test, two-tailed). See Source Data file for the exact P-values.

