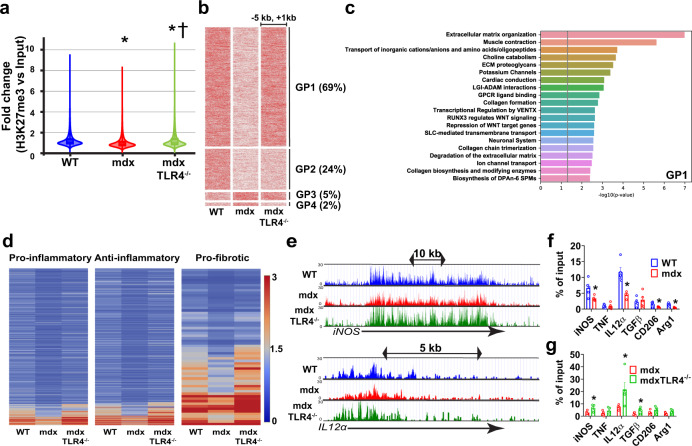
Fig. 6. Dynamic regulation of H3K27me3 is present in mdx BMDM and mediated by TLR4.
ChIP sequencing was performed in WT, mdx and mdxTLR4–/– BMDM: a Violin plots representing normalized intensity fold-change (H3K27me3 vs. Input) in the –5 kb to +1 kb neighboring genomic region around all genes across the whole genome; *P < 0.0001 compared to WT BMDM and †P < 0.0001 compared to mdx group (two-sided Mann–Whitney U-test). b Heatmaps showing, in order of frequency (indicated by the percentages in parentheses), the different Gene-based Patterns (GP1-4) of the normalized H3K27me3 read intensity (variable units proportional to red color intensity) within the nearby region [–5 kb to +1 kb] of the gene body for WT, mdx and mdxTLR4–/– BMDM. c Pathway enrichment analysis (Reactome database) for genes showing the predominant GP1 configuration (Supplementary Data 2 table shows the extended list for all Gene-based Patterns). The vertical line indicates the cutoff P-value = 0.05. d Heatmaps of H3K27me3 intensity for pre-defined genes representing prototypical pro-inflammatory, anti-inflammatory, and pro-fibrotic pathways (see Supplementary Data 3 table for complete gene lists). e Representative pro-inflammatory gene loci (iNOS, IL12α) showing the lower H3K27me3 peak intensity in the mdx group compared to WT and mdxTLR4–/–. f, g ChIP-qPCR was performed to detect H3K27me3 occupancy on the promoters of M1 and M2 marker genes in: f WT versus mdx BMDM (n = 4 for iNOS, IL12α, CD206 and Arg1 gene in mdx group, rest n = 5/group) and g mdx versus mdxTLR4-/- BMDM (n = 5/group); IgG was used as a control for non-specific binding of antibody. Data represent means ± SEM of biologically independent samples from different mice. *P < 0.05 by unpaired t-test, two-tailed). See Source Data file for the exact P-values.

