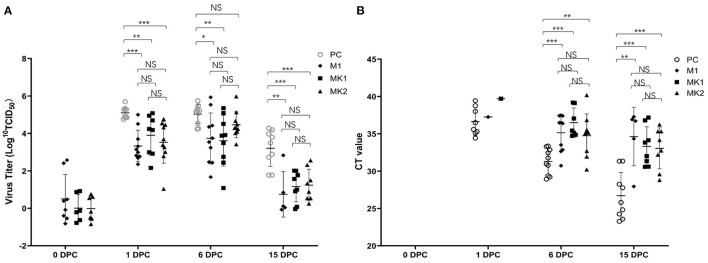
Figure 3.
Viremia and virus shedding in the challenged pigs. (A) The Log10TCID50 and the number of viremia pigs were presented at 0, 1, 6, and 15 DPC. Data are shown as mean ± standard error (error bars). (B) The CT value and the number of virus shedding pigs were presented at 0, 1, 6, and 15 DPC. The sample was pooled by nasal and oral swab. Data are shown as mean ± standard error (error bars) (*p < 0.05; **p < 0.01;***p < 0.001). NS, Not Statistically Significant.

