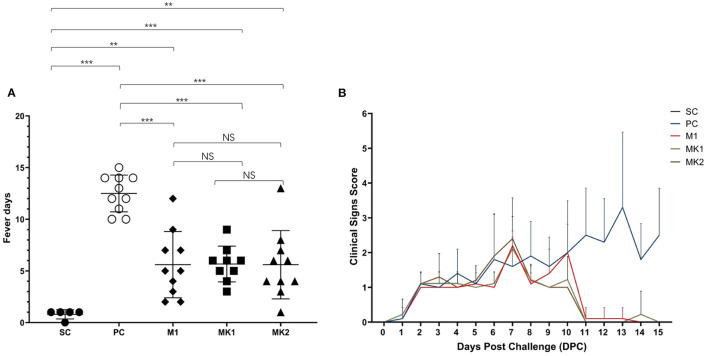
Figure 4.
Average fever days and clinical sign scores after challenged. (A) Average fever days per group are shown as mean ± standard error (error bars). (B) The scores of clinical signs were added up included gross clinical score (GCS), respiratory clinical score (RCS) and nervous signs score (NSS), the data were shown as mean ± standard error (error bars) (**p < 0.01; ***p < 0.001). NS, Not Statistically Significant.

