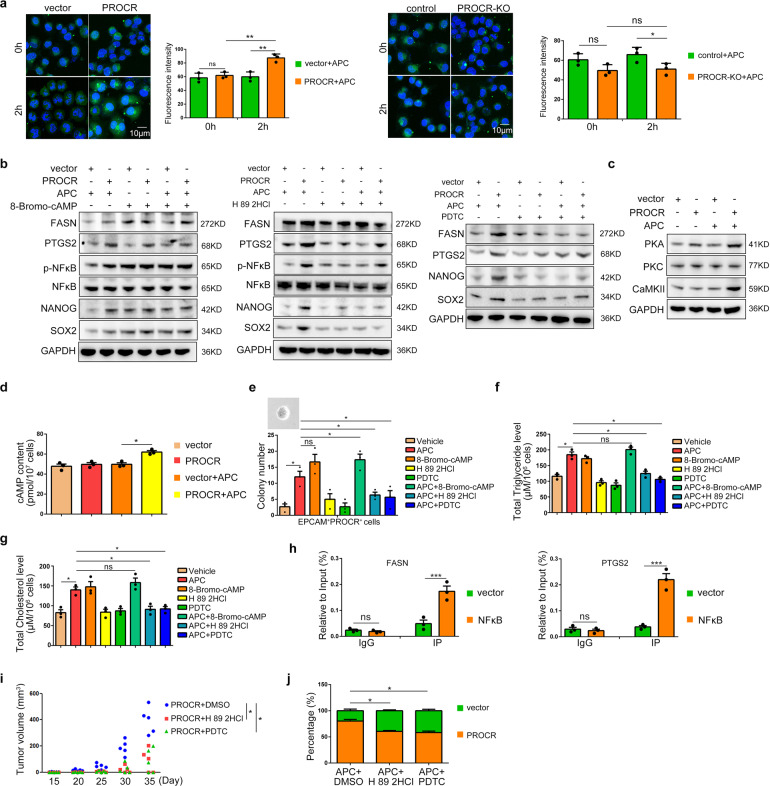
Fig. 5.
Signaling cascade induced by activated PROCR in NPC. a Ca2+ flux dynamics labeled by fluo-4 in PROCR overexpression or knockout cells. Living cells were observed right after the dye supplementation. The corresponding right panels show the statistical analysis of fluorescence intensity. b, c Western blotting analysis of lipid metabolism related genes expression and stem cell markers expression in vector or PROCR overexpressing cells with different drugs treatment. 8-Bromo-cAMP, PKA agonist; H 89 2HCl, PKA antagonist; PDTC, NFκB inhibitor. d ELISA detection of the cellular cAMP content in PROCR overexpressing cells. e Sphere forming assay of the sorted CD45-EPCAM+PROCR+ cells treated with different drugs. f, g The cell content of triglycerides and cholesterol in PROCR overexpressing cells treated with different drugs. h ChIP-PCR detection of the direct transcriptional regulation of NFκB on FASN or PTGS2 expression. i Subcutaneous xenograft tumor volume of PROCR overexpressing cells treated with different drugs; n = 5 for each group. All mice received APC activation. j Percentages of GFP+ cells from xenograft tumor nodules in the lungs of mice treated with different drugs. The drugs were administered every week; ns Not significant, *P < 0.05, ***P < 0.001

