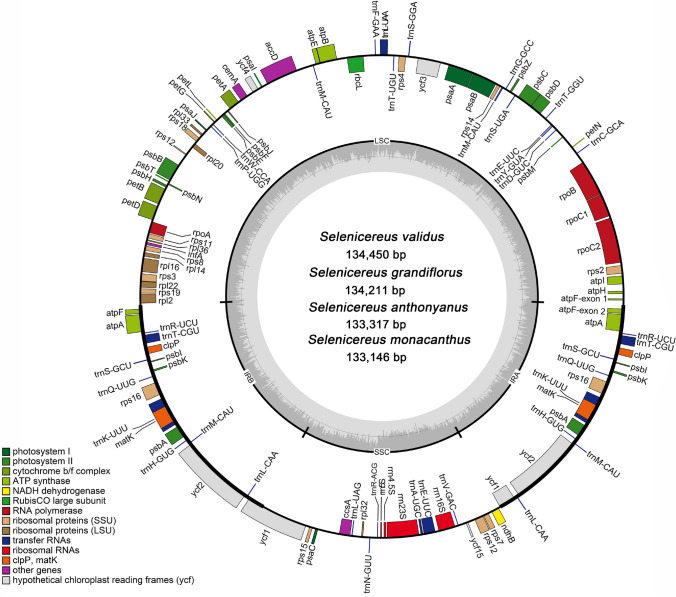
Fig. 1.
Plastid genome map of Selenicereus species and corresponding pictures of four plants. The thick line spacing in the inner circle represents a conservative quaternary structure, with LSC region, SSC region and a pair of IR region, and the dark gray area and light gray parts inside represent the ratio of GC and AT content, respectively

