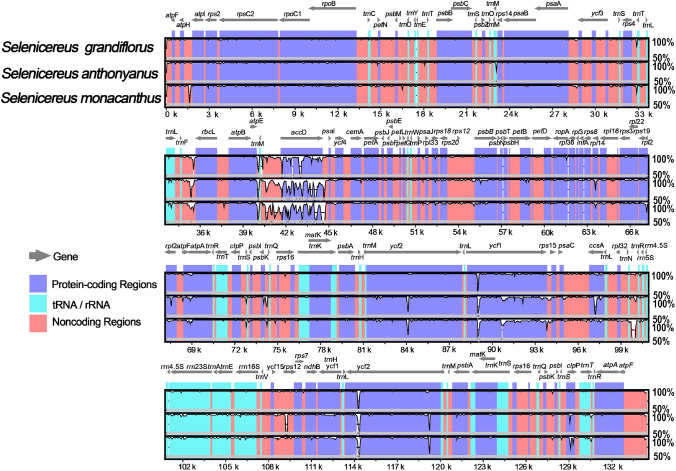
Fig. 4.
Sequence similarity of 4 Selenicereus species by using S.validus as a reference sequence and visualized in mVISTA. Different color markers represent different areas, the pink regions are conserved noncoding sequences, the purple regions are protein-coding sequences, the light blue regions are tRNA or rRNA and the gray arrows are the gene and its direction. The percentage of identity ranges from 50 to 100%, shown on the Y-axis

