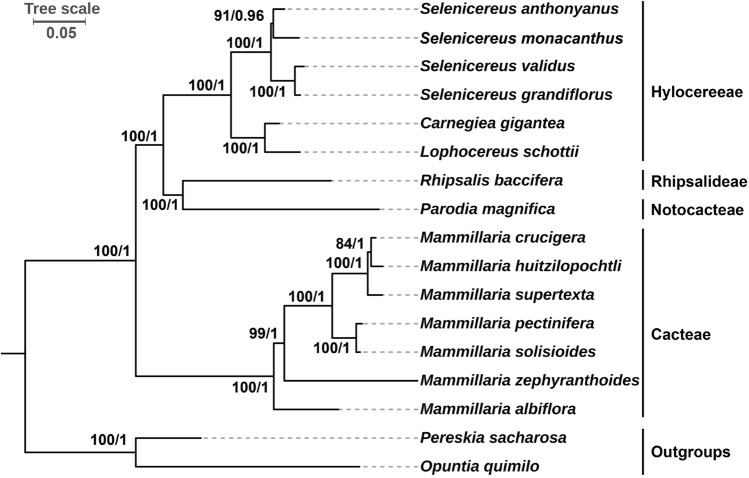
Fig. 8.
Phylogenetic relationships among 17 Cactaceae species. The 56 shared plastid protein coding genes (atpA, atpB, atpE, atpF, atpH, atpI, ccsA, cemA, clpP, infA, matK, petA, petB, petD, petG, petL, petN, psaA, psaB, psaC, psaI, psaJ, psbA, psbB, psbC, psbD, psbE, psbF, psbH, psbI, psbJ, psbK, psbM, psbN, psbT, rbcL, rpl14, rpl16, rpl20, rpl22, rpl2, rpoA, rpoB, rpoC1, rpoC2, rps11, rps12, rps14, rps15, rps19, rps2, rps3, rps4, rps7, rps8 and ycf3) were used as datasets to construct the phylogenetic trees by using the maximum likelihood (ML) method and Bayesian inference (BI) method. Pereskia sacharosa and Opuntia quimilo were used as outgroups. The scale number 0.05 indicates the length of the branch and the frequency of substitutions at 0.01 of the base at each site of the genome

