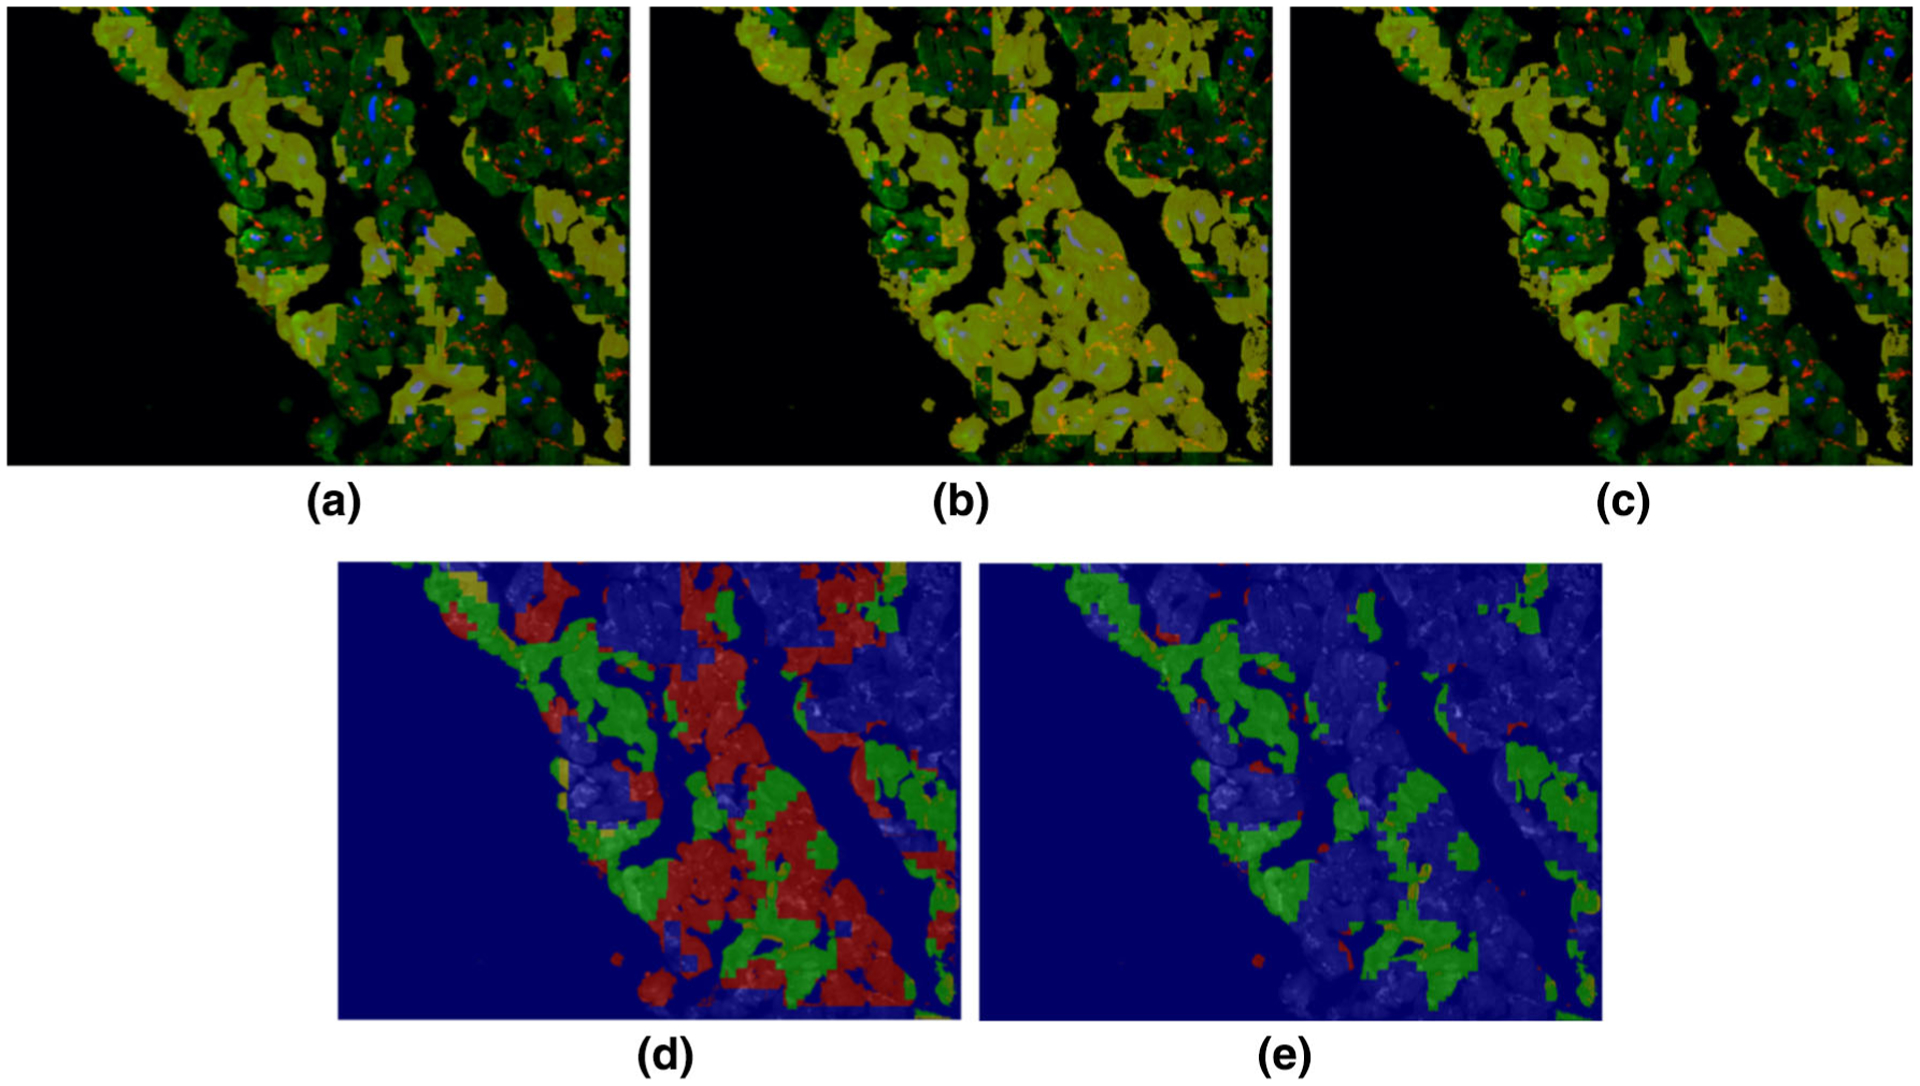
FIGURE 3.

An example of labeling of one cardiomyocytes image. The cardiomyocytes image is shown as a colored image in (a)–(c) where nuclear DAPI, cardiac troponin-T, and gap junction protein (connexin 43) are shown in, blue, green and red colors, respectively, and the yellow overlay (opacity 60%) labels the region of structural deterioration: (a) is the expert labeling (ground truth), (b) is the initial result from our framework before optimization, and (c) is the optimal result from our framework after optimization. Detection accuracy for the images in (b) and (e) are shown in (d) and (e) respectively, where the original cardiomyocytes image is shown as a background gray image. The green, blue, red, and yellow colors in (d) and (e) refer to the true positive, true negative, false positive, and false negative pixels, respectively.
