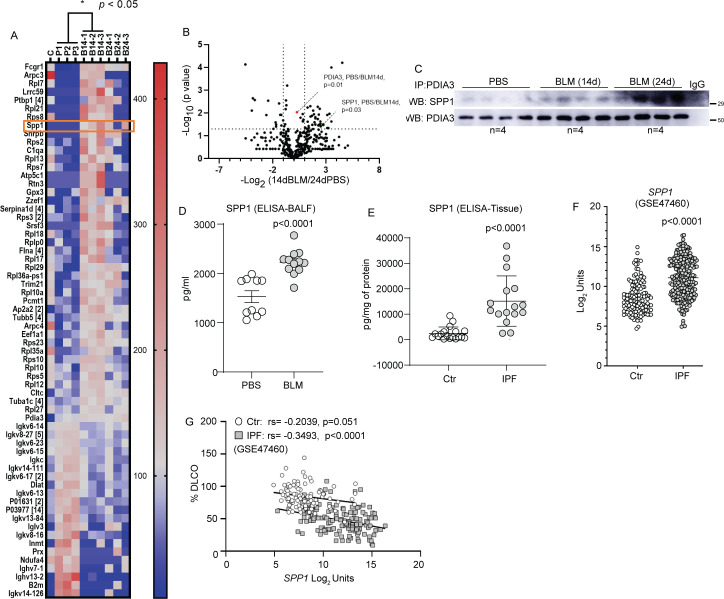
Figure 5.
Analysis of PDIA3 interacting partners and identification of SPP1 as a potential mediator of lung fibrosis. (A) Heat map of interacting partners of PDIA3 in fibrotic mouse lung analysed 14-day post-BLM challenge (n=3 samples/group, ‘C’ immunoprecipitation using non-specific IgG as a control). Identified proteins with a p value <0.05 (two-tailed t-test: 14-day post-BLM challenge vs PBS) are represented. The number beside the gene symbol indicates how many members in the cluster associated with that protein. The scale of the colour intensity is arbitrary. (B) Volcano plot depicting the significance of interactions of PDIA3 and SPP1 post immunoprecipitation and mass spectrometry. Fold changes of 2 and p value at 0.05 (two-tailed t-test: 24-day post-BLM challenge vs PBS) are indicated by dotted lines on the X-axis and y-axis, respectively. (C) Western blot analysis of immunoprecipitated PDIA3 and SPP1 in lung lysates (n=4 samples/group). (D) ELISA for SPP1 in bronchoalveolar lavage fluid samples of 24-day post-PBS (n=10) or BLM (n=12) challenged mice. (E) ELISA for SPP1 in lung tissue samples of control (n=18) and patients with IPF (n=16). (F) mRNA expression of SPP1 in control (n=132) and patients with IPF (n=160) from LGRC cohort. (G) Correlation of SPP1 mRNA expression with %DLCO in control (n=92) and patients with IPF (n=145) from LGRC cohort. Significance was based on unpaired two-tailed t-test and non-parametric Pearson correlation, non-parametric Mann-Whitney t-test. Error bars represent ±SEM for mouse samples and ±SD for human samples. ANOVA, analysis of variance; BLM, bleomycin; PBS, phosphate-buffered saline; PDIA3, protein disulfide isomerase A3.

