
Figure 2.
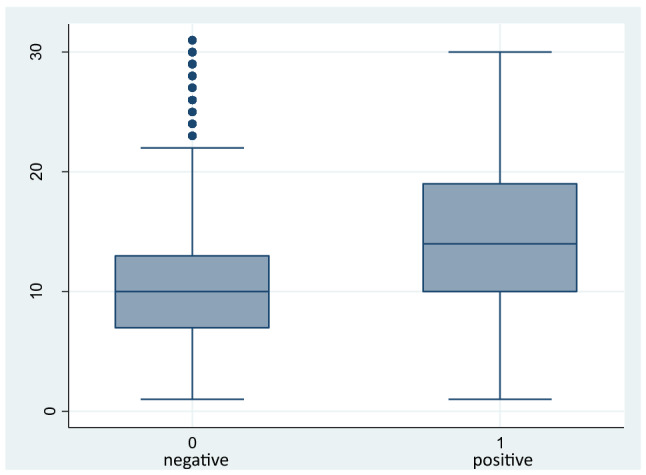
Box-plot analysis of numbers of swabs performed in negative (0) and positive (1) workers. Data are reported as median, 25°–75° percentile, minimum and maximum and outliers.
Official websites use .gov
A
.gov website belongs to an official
government organization in the United States.
Secure .gov websites use HTTPS
A lock (
) or https:// means you've safely
connected to the .gov website. Share sensitive
information only on official, secure websites.
Box-plot analysis of numbers of swabs performed in negative (0) and positive (1) workers. Data are reported as median, 25°–75° percentile, minimum and maximum and outliers.