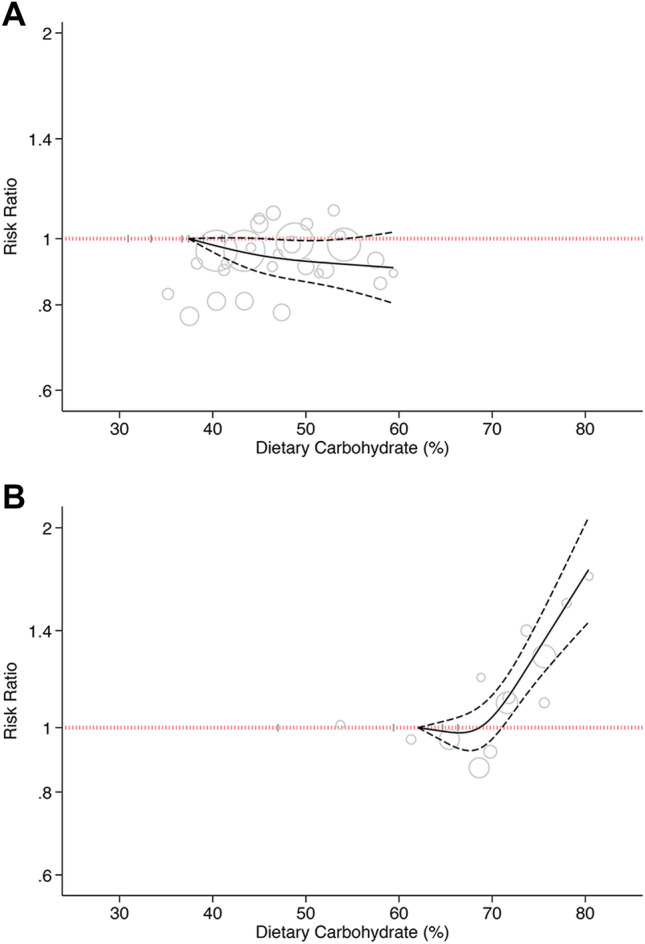
Figure 3.

Dose–response association between carbohydrate intake and risk of type 2 diabetes. (A) Western countries. (B) Asian countries. Solid line represents non-linear dose response and dotted lines represent 95% confidence interval. Circles represent hazard ratio point estimates for carbohydrate intake categories from each study with circle size proportional to inverse of standard error. Small vertical grey lines are baseline carbohydrate intake categories in each study.
