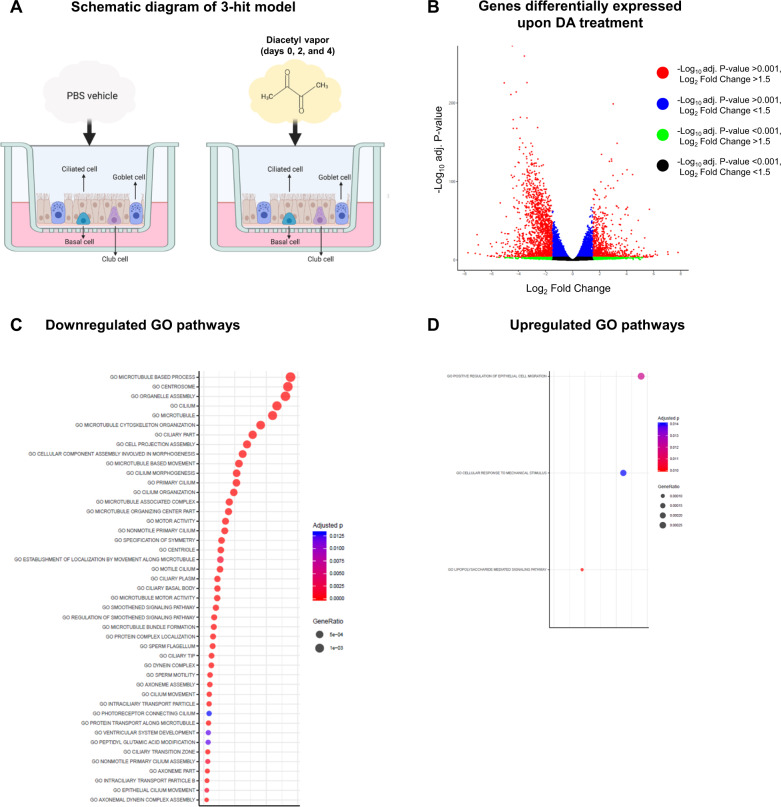
Fig. 1. Diacetyl (DA) vapor exposure of normal human bronchial epithelial cells (NHBECs) drives differential transcriptomic responses.
A Schematic diagram of 3-hit model of PBS vehicle- and diacetyl (DA) vapor exposure of NHBECs. Triplicate wells of NHBECs from donor TBE-20 were exposed to PBS vehicle or DA vapor at 0, 2, and 4 days prior to RNA-seq analysis on day 6. B Volcano plot of RNA-seq results where genes are represented by red dots (−log10 adjusted P value < 0.001, log2 fold change > 1.5), blue dots (−log10 adjusted P value < 0.001, log2 fold change < 1.5), green dots (−log10 adjusted P value > 0.001, log2 fold change > 1.5), and black dots (−log10 adjusted P value > 0.001, log2 fold change < 1.5). C Down- and D upregulated gene ontology (GO) pathways with an FWER adjusted P value < 0.015 were reported. Dot size represents gene ratio and color schema represents FWER adjusted P values.

