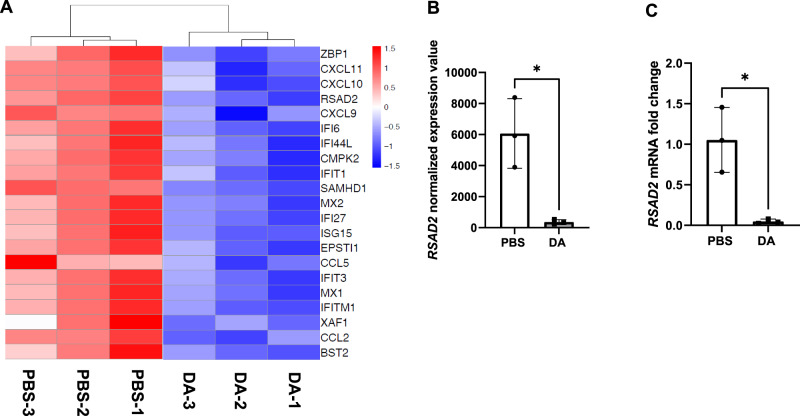
Fig. 5. Decreased expression of interferon-stimulated genes after diacetyl (DA) vapor exposure in normal human bronchial epithelial cells (NHBECs).
A Heatmap of interferon-stimulated genes that are downregulated following DA treatment. Red represents relative upregulation of gene expression and blue represents relative downregulation of gene expression. Genes are arranged by log2 fold change with the largest log2 fold change at the top and the smallest log2 fold change at the bottom. B RSAD2 normalized expression data from RNA-seq analysis and C validation of RSAD2 expression by qRT-PCR shown as fold change after DA vapor exposure. All quantified results are expressed as mean ± SD. n = 3 per group. Significance was determined by an unpaired t test. *P < 0.05.

