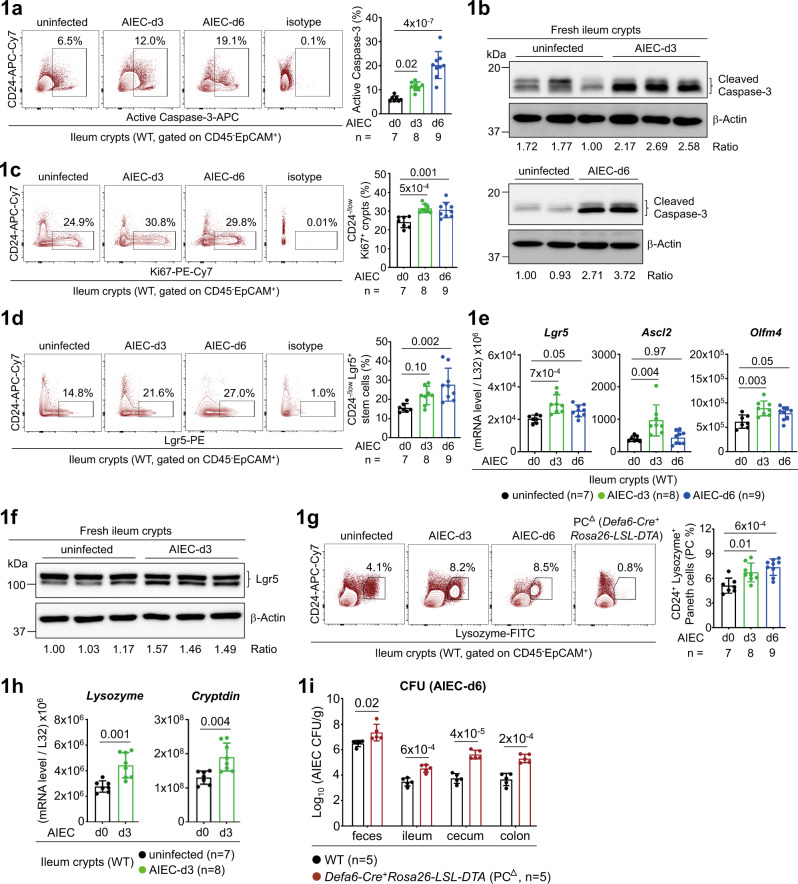
Fig. 1. Crohn’s AIEC induces an early response of stem cells and Paneth cells.
a Flow cytometry analysis of CD45- EpCAM+ ileum crypts for active Caspase-3+ apoptotic cells in uninfected and AIEC-infected mice at day-3 (d3) and day-6 (d6) post infection. b Western blot analysis of ileum crypts for active Caspase-3+ apoptotic cells. Quantification and the ratio (Caspase-3 to β-actin) of protein bands are indicated. c Flow cytometry analysis of CD24-/low ileum crypts for Ki67+ proliferating cells in uninfected and AIEC-infected mice at d3 and d6. d Flow cytometry analysis of CD24-/low ileum crypts for Lgr5+ stem cells in uninfected and AIEC-infected mice at d3 and d6. e Quantitative real-time PCR analysis of ileum crypts for stem cell marker Lgr5, Ascl2, and Olfm4 in uninfected and AIEC-infected mice. f Western blot analysis of ileum crypts for stem cell marker Lgr5 in the indicated mice. Quantification and the ratio (Lgr5 to β-actin) of protein bands are indicated. g Flow cytometry analysis of CD24+ ileum crypts for Lysozyme+ Paneth cells in the indicated mice. Ileum crypts isolated from Paneth cell-deficient (PC∆) Defa6-Cre+Rosa26-LSL-DTA mice were used to gate the Paneth cell population. h Quantitative real-time PCR analysis of ileum crypts for Paneth cell marker Lysozyme and Cryptdin in the indicated mice. i Colony-forming unit (CFU) of AIEC was analyzed in feces and intestinal tissues isolated from the indicated mice at d6 post AIEC infection. Each symbol in bar graphs represents an ileum crypt sample (a, c, d, e, g, h) or tissue sample (i) derived from one mouse. Data shown are representative (b, f, i) or combined (a, c, d, e, g, h) results from two independent reproducible experiments. Statistical significance is indicated using unpaired two-tailed t test (h, i) or One-way ANOVA with Sidak’s multiple comparisons test (a, c, d, e, g). Data are presented as mean ± SD. Source data are provided as a Source Data file.

