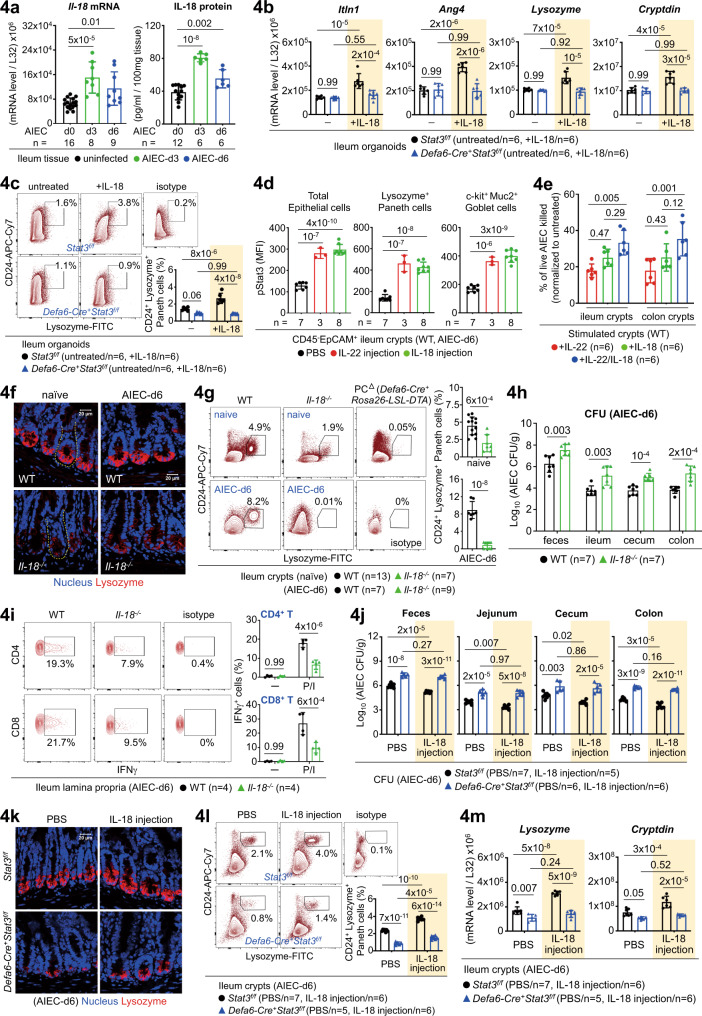
Fig. 4. IL-18 is a bona fide regulator of Paneth cells during AIEC host defence.
a Quantitative real-time PCR and ELISA analyses of ileum crypts or tissues for IL-18 in uninfected or AIEC-infected mice. b Quantitative real-time PCR analysis of IL-18-stimulated ileum organoids, derived from the indicated mice, for anti-microbial peptides. c Flow cytometry analysis of IL-18-stimulated ileum organoids, derived from the indicated mice, for CD24+ Lysozyme+ Paneth cells. d Flow cytometry analysis of ileum crypts, derived from IL-22 or IL-18-injected mice, for phospho-Stat3 (pStat3) in the indicated epithelial subsets. Mean fluorescence intensity (MFI) of pStat3 is indicated. e Fresh crypts were stimulated with IL-22, IL-18, or both, to induce the release of anti-microbial peptides (AMP). The AMP-containing supernatants were then incubated with live AIEC and the percentage of bacterial killing was determined by the CFU assay after normalized to unstimulated crypts. f Immunofluorescence analysis of ileum crypts (outlined with a dashed line) for Lysozyme+ Paneth cells at the crypt base in the indicated mice. g Flow cytometry analysis of ileum crypts, derived from the indicated mice, for CD24+ Lysozyme+ Paneth cells. h Colony-forming unit (CFU) of AIEC was analyzed in feces and intestinal tissues isolated from the indicated mice at d6 post infection. i Flow cytometry analysis of PMA/Ionomycin (P/I)-stimulated ileum lamina propria cells for intracellular IFNγ in CD4+ or CD8+ T cells in AIEC-infected mice. j CFU of AIEC was analyzed in feces and intestinal tissues isolated from the indicated PBS or IL-18-injected mice at d6 post infection. k Immunofluorescence analysis of ileum crypts for Lysozyme+ Paneth cells at the crypt base in the indicated IL-18-injected mice at d6 post AIEC infection. l Flow cytometry analysis of ileum crypts, derived from the indicated IL-18-injected mice, for CD24+ Lysozyme+ Paneth cells. m Quantitative real-time PCR analysis of ileum crypts from the indicated IL-18-injected mice, for Paneth cell marker Lysozyme and Cryptdin. Each symbol in bar graphs represents an ileum crypt sample (a, d, e, g, l, m), tissue sample (a, h, i, j), or organoid culture (b, c), derived from one mouse. Data shown are representative (f, i, k) or combined (a–e, g, h, j, l, m) results from two independent reproducible experiments. Figures 2f and 4c were performd in the same experiment. Statistical significance is indicated using unpaired two-tailed t test (g, h), One-way ANOVA with Sidak’s multiple comparisons test (a, d, e), or Two-way ANOVA with Tukey’s multiple comparisons test (b, c, i, j, l, m). Data are presented as mean ± SD. Source data are provided as a Source Data file.

