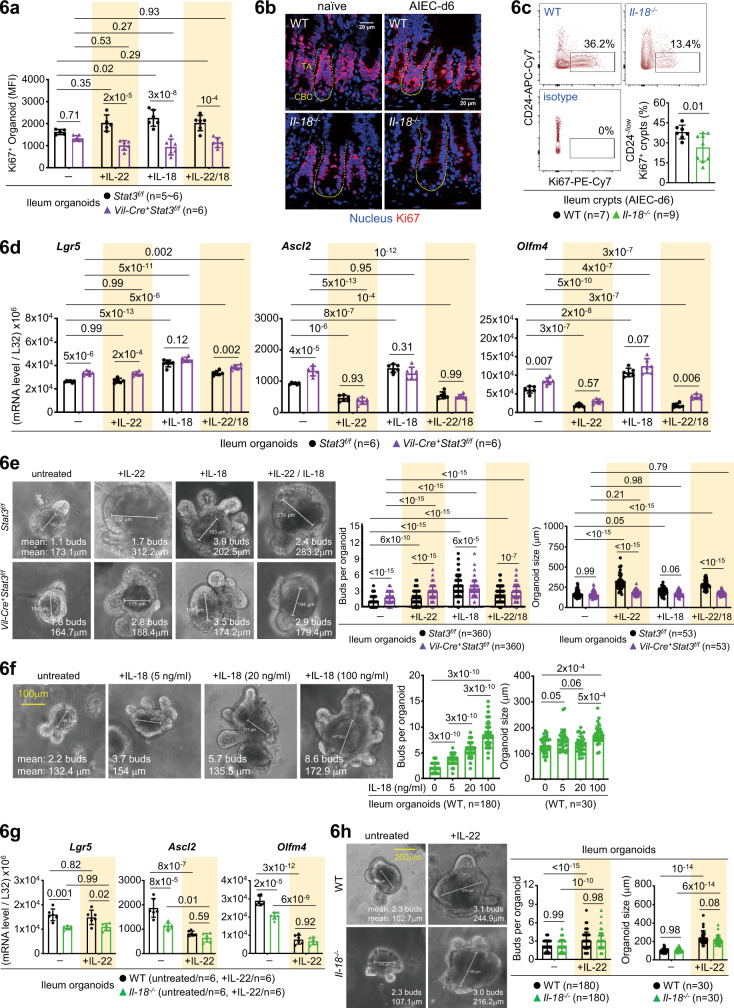
Fig. 6. Differential role of IL-22 and IL-18 in organoid culture.
a Flow cytometry analysis of IL-22 or IL-18-stimulated ileum organoids, derived from the indicated mice, for Ki67+ proliferating cells. Mean fluorescence intensity (MFI) of Ki67+ organoids is shown. b Immunofluorescence analysis of ileum crypts for Ki67+ proliferating cells in the indicated naïve or AIEC-infected mice. Crypt base columnar (CBC, outlined with a solid line) stem cell and the above transit-amplifying (TA, outlined with a dashed line) compartments are indicated. c Flow cytometry analysis of ileum crypts for CD24-/low Ki67+ proliferating cells in the indicated AIEC-infected mice. d Quantitative real-time PCR analysis of IL-22 or IL-18-stimulated ileum organoids, derived from the indicated mice, for stem cell marker Lgr5, Ascl2, and Olfm4. e Quantification of the number of buds per organoid and size in IL-22 or IL-18-stimulated ileum organoids, derived from the indicated mice. “n” indicates the number of images taken from organoids derived from four mice in each group. f Quantification of the number of buds in IL-18-stimulated wild-type ileum organoids. “n” indicates the number of images taken from organoids derived from three mice per group. g Quantitative real-time PCR analysis of IL-22-stimulated ileum organoids, derived from the indicated mice, for stem cell marker Lgr5, Ascl2, and Olfm4. h Quantification of the number of buds per organoid and size in IL-22-stimulated ileum organoids, derived from the indicated mice. “n” indicates the number of images taken from organoids derived from four mice per group. Each symbol in bar graphs represents an ileum crypt sample (c) or organoid culture (a, d, g), derived from one mouse. Data shown are representative (b) or combined (a, c–h) results from two independent reproducible experiments. Statistical significance is indicated using unpaired two-tailed t test (c), One-way ANOVA with Sidak’s multiple comparisons test (f), or Two-way ANOVA with Tukey’s multiple comparisons test (a, d, e, g, h). Data are presented as mean ± SD. Source data are provided as a Source Data file.

