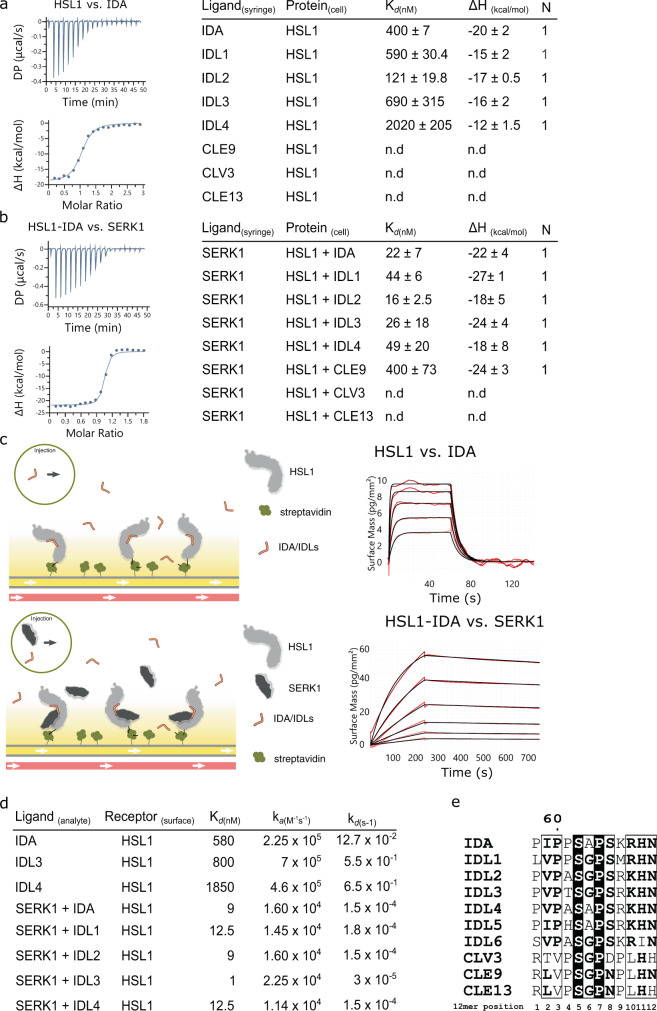
Fig. 1. HSL1 senses IDA/IDL peptides with high affinity and forms a stable complex with the co-receptor SERK1.
a ITC binding experiments and summary table of IDA/IDL and CLE peptides versus HSL1 ectodomain. Kd (dissociation constant) indicates the binding affinity between the two molecules considered (in nanomolar). The N indicates the reaction stoichiometry (n = 1 for a 1:1 interaction). The values indicated in the table are the mean ± SD of at least two independent experiments. b Contribution of the SERK1 co-receptor to the HLS1-IDA/IDLs and HSL1-CLE ternary complex formation. ITC experiments and results table of titrating SERK1 protein into a solution containing HSL1 and the indicated peptide. c Schematic overview of the GCI binding experiments. Experiments were done using Avi-tag-based coupling. Streptavidin (in green) was immobilized using direct amine coupling to the chip. Next, the biotinylated ectodomain of HSL1 was captured by streptavidin. IDA/IDLs (top) or SERK1 + IDA/IDLs (bottom) were used as analytes in the different experiments. Binding kinetics of HSL1 receptor vs. IDA, and HSL1-IDA complex vs. SERK1 obtained from GCI experiments. The sensograms with recorded data are shown in red with the respective fits in black. d GCI summary table of HSL1 vs. IDA/IDLs and contribution of SERK1 to the kinetics of the ternary complex formation. The table contains the corresponding association rate constant (ka), dissociation rate constant (kd), and the dissociation constant Kd from experiments reported in Supplementary Fig. 4. e Sequence alignment of the mature peptides of IDA/IDLs, and CLE9, CLV3, and CLE13.

