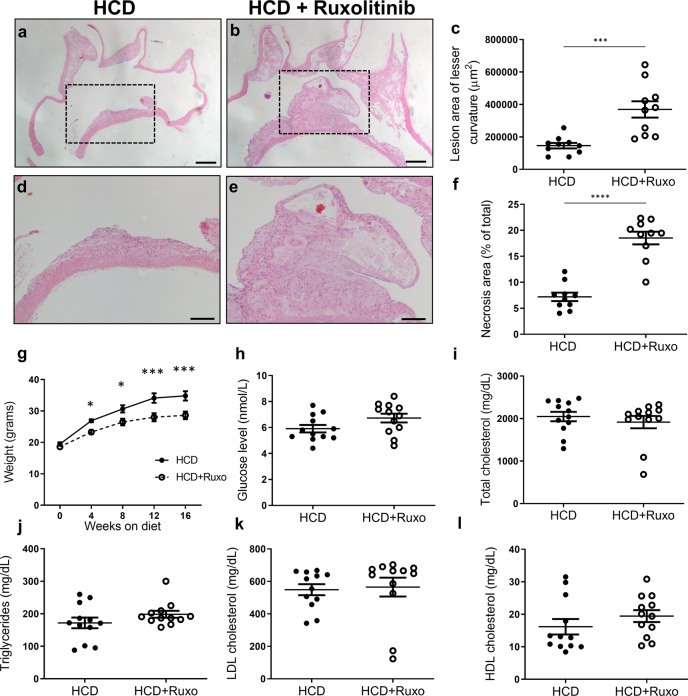
Fig. 5. Effects of ruxolitinib in atherosclerosis.
a, b Representative images of sagittal aortic arch sections stained with H&E from ApoE KO mice fed either HCD with or without ruxolitinib for 16 weeks. Scale bar, 200 µm. c Quantification of lesion size at the lesser curvature (µm2) (n = 10/group). d, e Magnification of region of interest from (a, b). Scale bar, 100 µm. f Quantification of the necrotic area within the plaque expressed as a percentage of total area (n = 10/group). g Body weights of ApoE KO mice treated with or without ruxolitinib while on 16 weeks of HCD (n = 12 per group). h–l and their fasting blood glucose and lipid levels (n = 12/group). Statistical analysis: c–f, h–l) two-tailed unpaired t tests and (g) multiple t tests with Holm–Sidak correction were performed. Data are presented as the mean ± SEM, *P < 0.05, ***P < 0.001, ****P < 0.0001. See also Supplementary Fig. S12.

