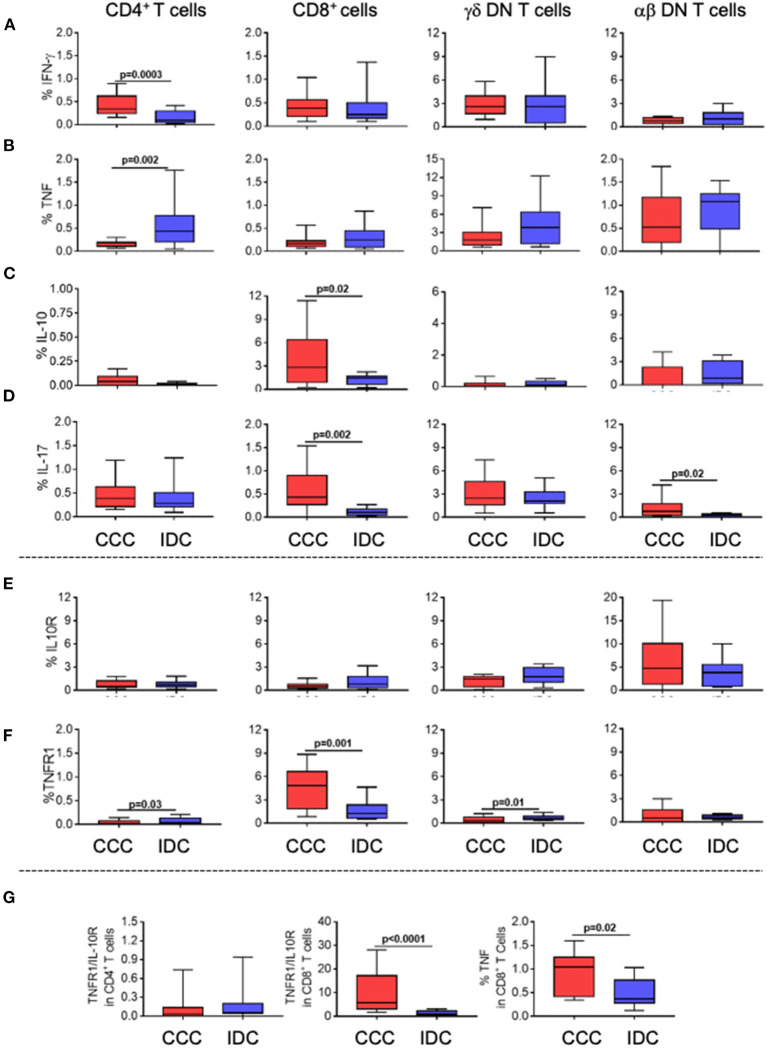
Figure 3.
Cellular immune profile of cytokines and immunoregulatory receptors in T-cell subpopulations in different cardiomyopathies. Frequency of expression of cytokines and immunoregulatory receptors (A) IFN-gamma, (B) TNF, (C) IL-10 (D) IL-17 (E) IL-10R, (F) TNF-R1. The analysis was performed as described in the materials and methods for comparison between the different groups in CD4+, CD8+, gamma-delta+ (CCC, n = 17, IDC, n = 13) and alpha-beta+ DN T cells (CCC, n = 10, IDC, n = 10). (G) analysis of the ratio of TNFR1+/IL10R+ cells in CD4+ and CD8+ T cells; TNF expression in CD8+ T cells stimulated with PMA/Ionomycin (CCC, n = 7; IDC, n = 8). Values of p < 0.05 were considered statistically significant. Graphs are expressed as boxplots, with the minimum and maximum values indicated.

