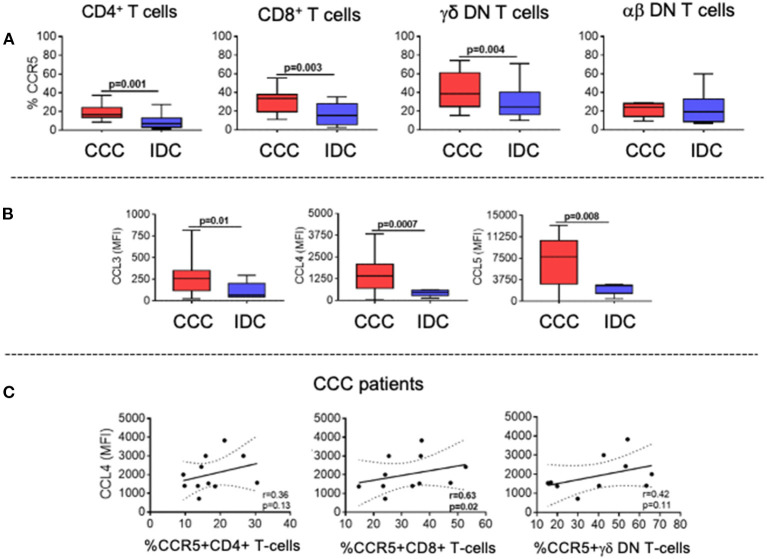
Figure 5.
Expression of CCR5 by the different T-cell subpopulations and of its soluble chemokine ligands CCL3, CCL4, CCL5. (A) Evaluation of the frequency of expression of CCR5 by CD4+, CD8+, gamma-delta+ DN T cells (CCC, n = 17, IDC, n = 13) and alpha-beta+ DN T cells (CCC, n = 10, IDC, n = 10). The analysis was performed as described in the materials and methods for comparison between the different groups. (B) Plasma levels of soluble chemokines (CCL3, CCL4, CCL5) in samples from patients with Chronic Chagas cardiomyopathy (CCC, n = 38) and idiopathic cardiomyopathy (IDC, n = 5). Graphs are expressed as boxplots, with the minimum and maximum values indicated. (C) Correlation analysis between plasma levels of CCL4 and the frequency of expression of CCR5 in CD4+, CD8+ and gamma-delta+ DN T cells in CCC group. Parametric data were analyzed using Pearson's correlation test and non-parametric data using Spearman's test. Values of p < 0.05 were considered statistically significant.

