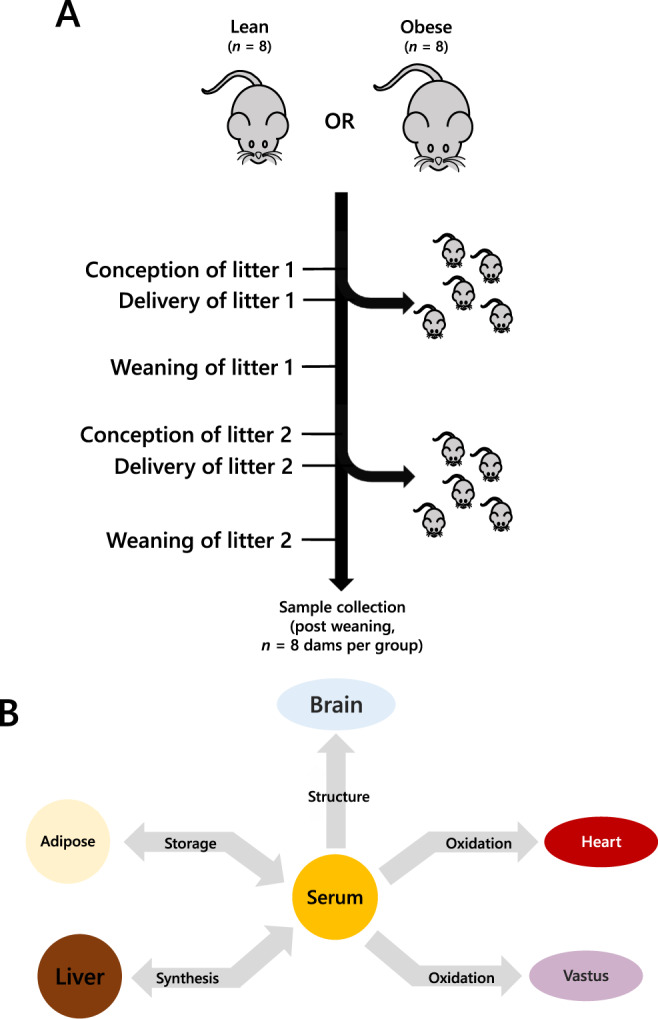
Fig. 1. The tissue network of the mouse model of obese-GDM used in the present study.

A Schematic representation of the mouse model showing the groups, pregnancies and weaning. B The network that describes the lipid traffic associated with this model, including tissues whose activity is typically associated with diet-driven diabetes. The termini represent traffic flow from synthesis (liver), for structural purposes (CNS), fatty acid oxidation (heart, vastus, liver) and storage (adipose). This metabolic relationship between tissues was used as the structure of the network for all analyses in the present study. Lean refers to mice fed exclusively a diet of normal chow ad libitum whereas Obese refers to mice fed a high fat diet drawn from mainly dairy fat sources.
