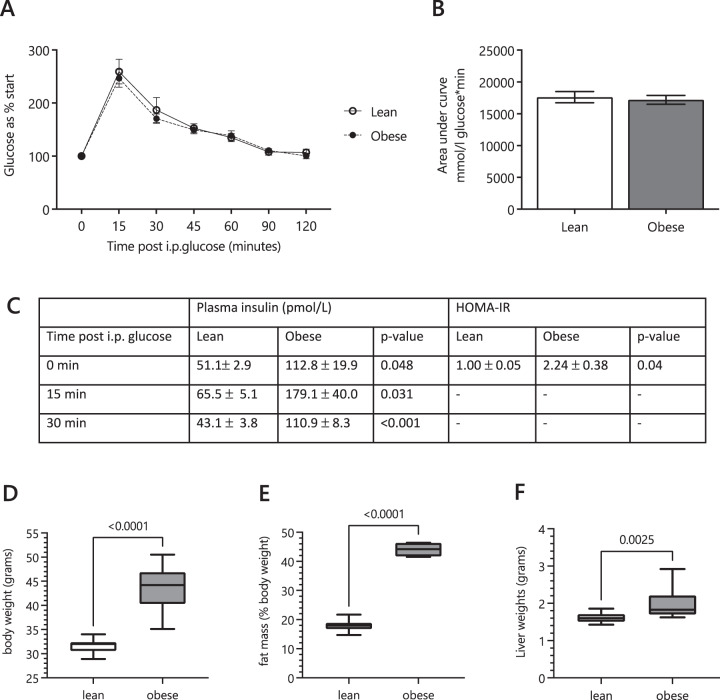
Fig. 2. Glucose tolerance test and gross body composition of the mouse model at the time of tissue collection.
A Blood glucose concentrations in post-weaning dams during a glucose tolerance test (GTT). B Glucose area under the curve during the GTT. C Insulin concentrations in dams’ plasma at basal (0), 15 and 30 min post glucose challenge and calculated fasting HOMA-IR (0 min). D Dam bodyweight at weaning. E Dam fat mass (measured by TDNMR) as a percentage of bodyweight at weaning. F Dam liver mass at weaning. The p values are based on unpaired Student t-tests between the lean and obese groups for comparisons given above braces between distributions. I.P., Intra-peritoneal; HOMA-IR, HOmeostatic Model Assessment for Insulin Resistance.

