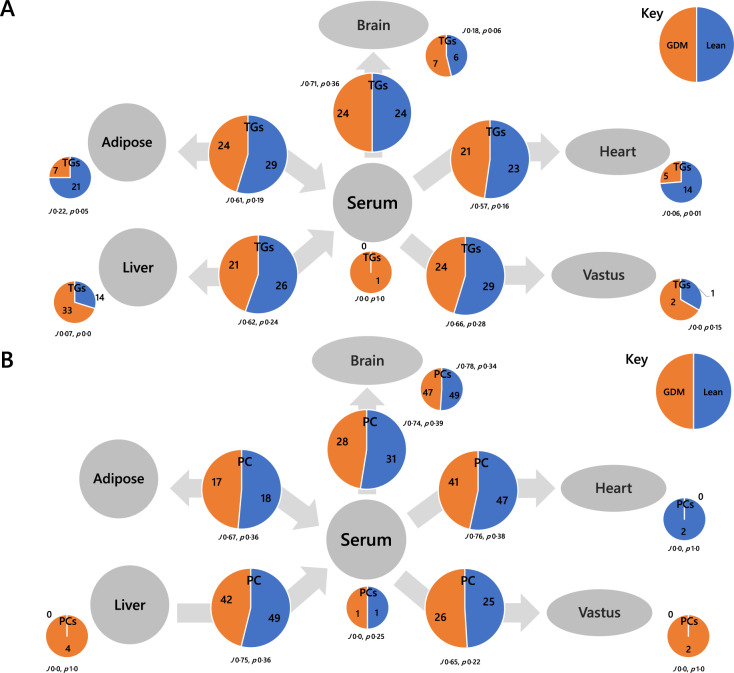
Fig. 5. Switch analysis of the tissue network used in the present study.
A Triglycerides (TGs), B Phosphatidylcholines (PCs). Small pie charts represent the numbers of variables only found in the given tissue, larger pie charts represent the numbers of variables found in both adjacent tissues. J represents the Jaccard-Tanimoto distance and p the accompanying probability that the binary list of variables for the two groups differed by random chance [27].

