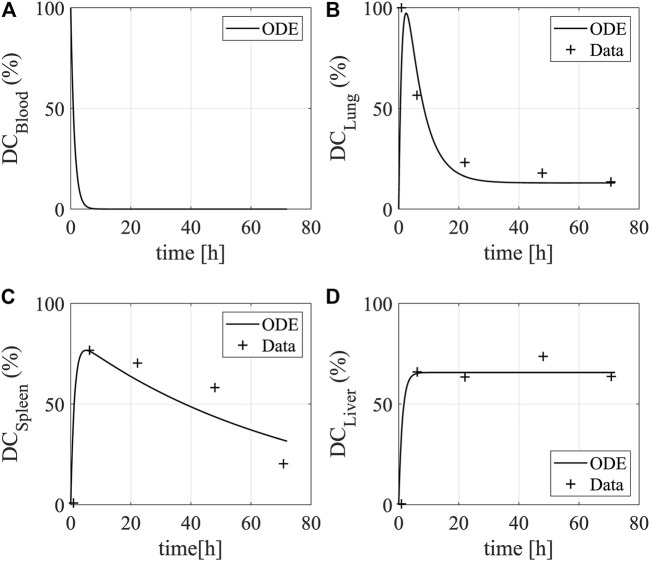
FIGURE 2.
Dynamics of DCs in human organs. The plots show the bio-distribution and kinetics of DCs in (A) the blood (B) the lung, (C) the spleen, and (D) the liver. The data show the uptake (y-axis) of intravenously injected DCs over time (x-axis). The lines and star asterisks denote model simulations and experimental data, respectively. The experimental data is from Figure 2 in Mackensen et al. (1999). The temporal distribution of DCs were quantified by radioactivity in the lung, spleen, and liver of a patient after intravenous injection for 72 h.

