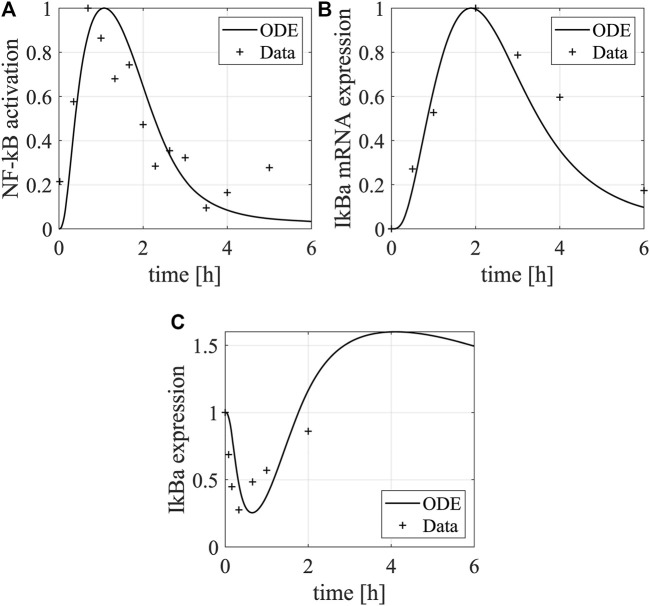
FIGURE 3.
Dynamics of IκBα and NF-κB in DCs. The plots show the dynamics of (A) NF-κB protein and (B) IκBα mRNA and (C) protein in DCs after LPS stimulation. The lines and asterisks denote model simulations and experimental data, respectively. The NF-кB activation was characterized by its binding activity to DNA, and the experimental data were normalized to the maximal binding activity (Figure 3C in Bode et al., 2009). The data shown here is a representative of three independent experiments. The IκBα mRNA was measured by qPCR (Figure 5A in Bode et al., 2009) and its relative mean expression (normalized to the maximal value) in comparison to the mRNA encoding the house-keeping gene β-actin was shown. The IκBα protein expression was quantified using a representative western blot (Figure 3A in Bode et al., 2009) and normalized to the maximal value. The western blot data was quantified using the software ImageJ.

