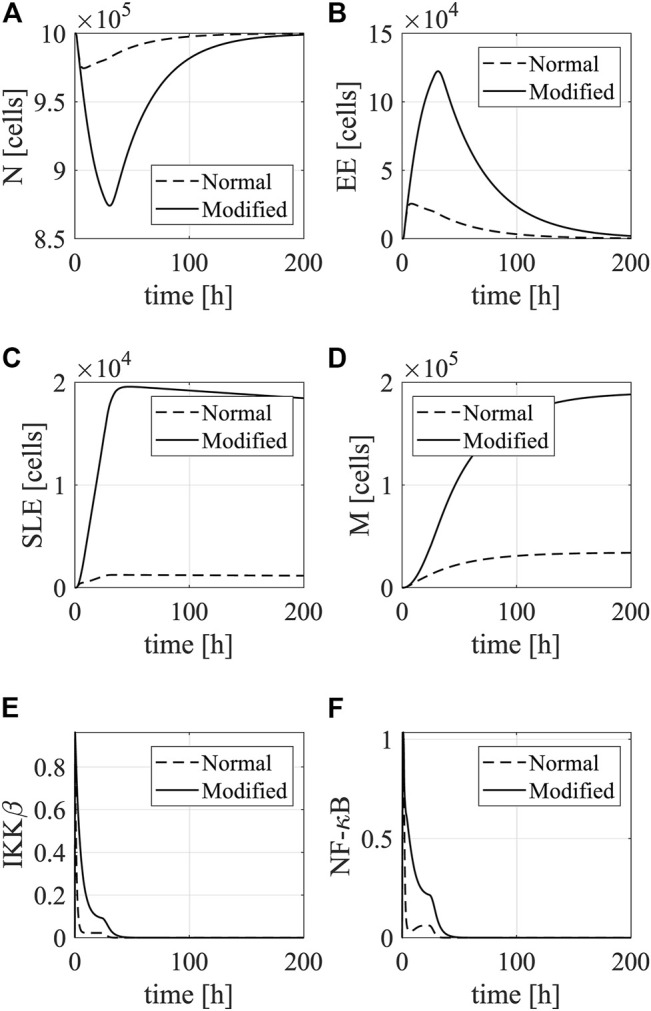
FIGURE 7.

Simulations of DC-mediated T-cell response. The plots show dynamics of (A) Naive T cells, (B) early effector T cells, (C) short-lived effector T cells, and (D) memory T cells in the spleen after stimulation with mock-electroporated DCs (dotted line) and caIKKβ-mRNA-electroporated DCs (solid line). Besides, we show the dynamics of (E) IKKβ and (F) NF-κB in DCs (non-dimensionalized).
