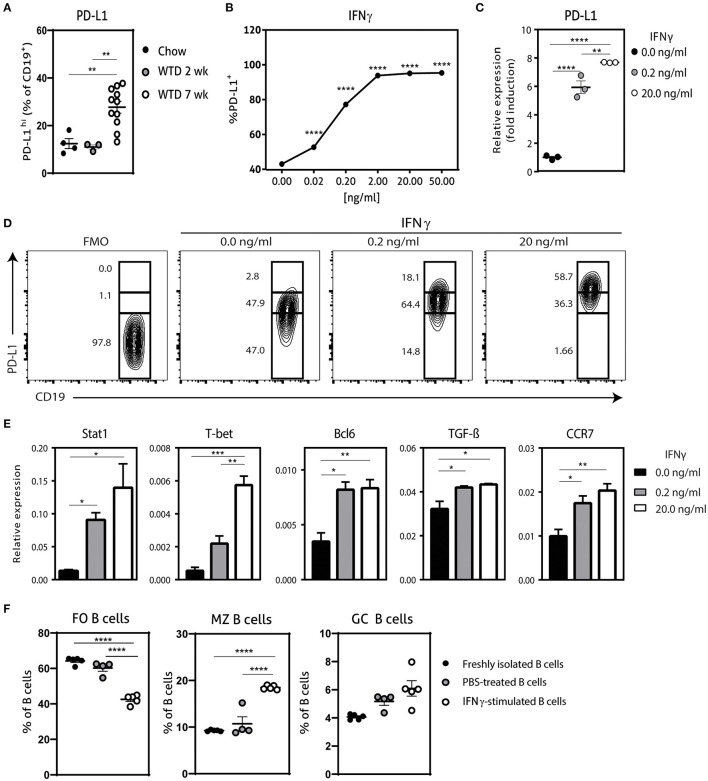
Figure 1.
Characterization of IFNγ-stimulated B cells. (A) PD-L1hi expressing CD19+ B cells were determined in spleens of apoE−/− mice fed a regular Chow diet or Western type diet for 2 or 7 weeks using flow cytometry. (B) CD19+ B cells were isolated from C57BL/6 mice and stimulated for 24 h with different doses interferon-gamma (IFNγ) after which PD-L1 protein expression was measured with flow cytometry. (C) CD19+ B cells were unstimulated or stimulated with 0.2 ng/ml or 20.0 ng/ml IFNγ for 24 h, after which mRNA expression of PD-L1 was assessed using qPCR. (D) B cells as stimulated in (C) were analyzed for PD-L1lo, PD-L1int and PD-L1hi expression with flow cytometry. (E) mRNA expression was analyzed for depicted genes in B cells as stimulated in (C). (F) FO B cells (CD23+) MZ B cells (CD23− CD21+) and GC B cells (GL-7+ CD95+) were determined in CD19+ B cells stimulated with 20.0 ng/ml IFNγ for 24 h. Data are analyzed with a One-Way ANOVA and shown as mean ± SEM (*p < 0.05, **p < 0.01, ***p < 0.001, ****p < 0.00001). n = 3–11/group.

