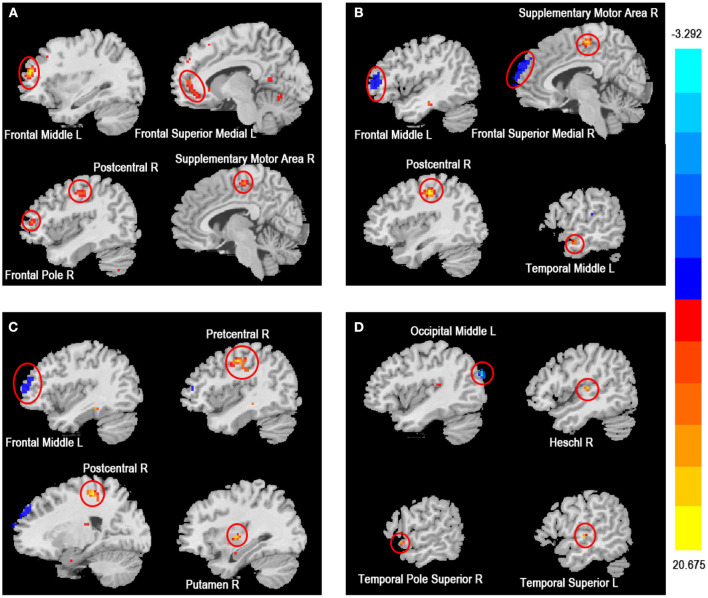
Figure 2.
Brain regions with abnormal ReHo among three groups based on one-way ANOVA. Significant increased (red) and decreased (blue) ReHo values in among active CD, inactive CD, and HC groups (GRF corrected, voxel p < 0.001, cluster p < 0.01). The color bar represents the t-value. (A) The main effect analysis revealed significant differences in ReHo values of the left frontal middle, left frontal superior medial, right postcentral, right frontal pole and right supplementary motor area among the three groups. (B) The post-hoc analysis showed that the ReHo values of the right frontal superior medial, left frontal middle in the HC group were lower and the right postcentral, right supplementary motor area, and left temporal middle were higher than the ReHo values of the active CD group. (C) The post-hoc analysis showed that the ReHo values of the left frontal middle in the HC group was lower and the right precentral, right postcentral and right putamen were higher than the ReHo values of the inactive CD group. (D) The post-hoc analysis showed that the ReHo values of the left occipital middle in the active CD group was lower and the right heschl, right temporal pole superior and left temporal superior were higher than the ReHo values of the inactive CD group. CD, Crohn's disease (CD); ReHo, regional homogeneity; HC, healthy controls; L, left; R, right.

