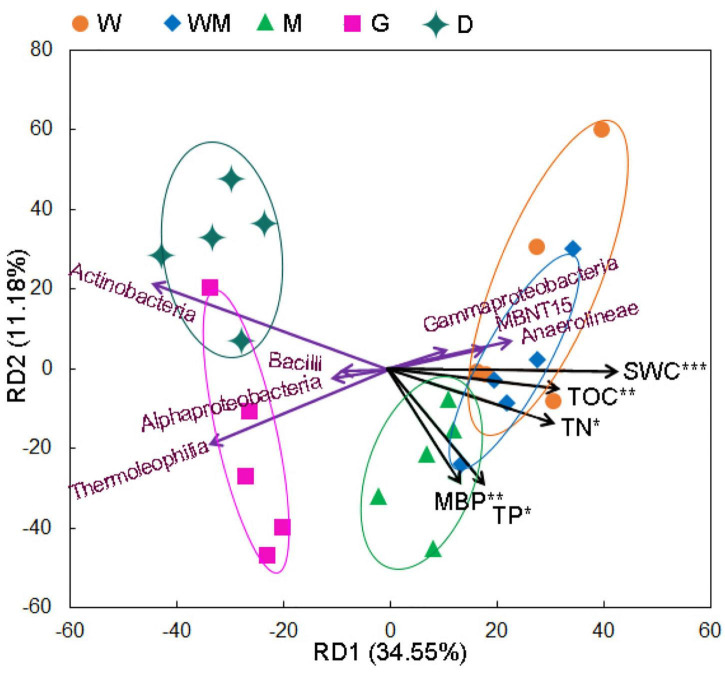
FIGURE 5.
Redundancy analysis (RDA) of the multivariate relationships among soil properties and microbial classes along degradation gradients (W, typical wetland; WM, wet meadow; M, meadow; G, grassland; D, desert). MBP, microbial biomass phosphorus; SWC, soil water content; TP, total phosphorus; TOC, total organic carbon; TN, total nitrogen. *, **, and *** represent significant correlation at P < 0.05, P < 0.01, and P < 0.001, respectively.

