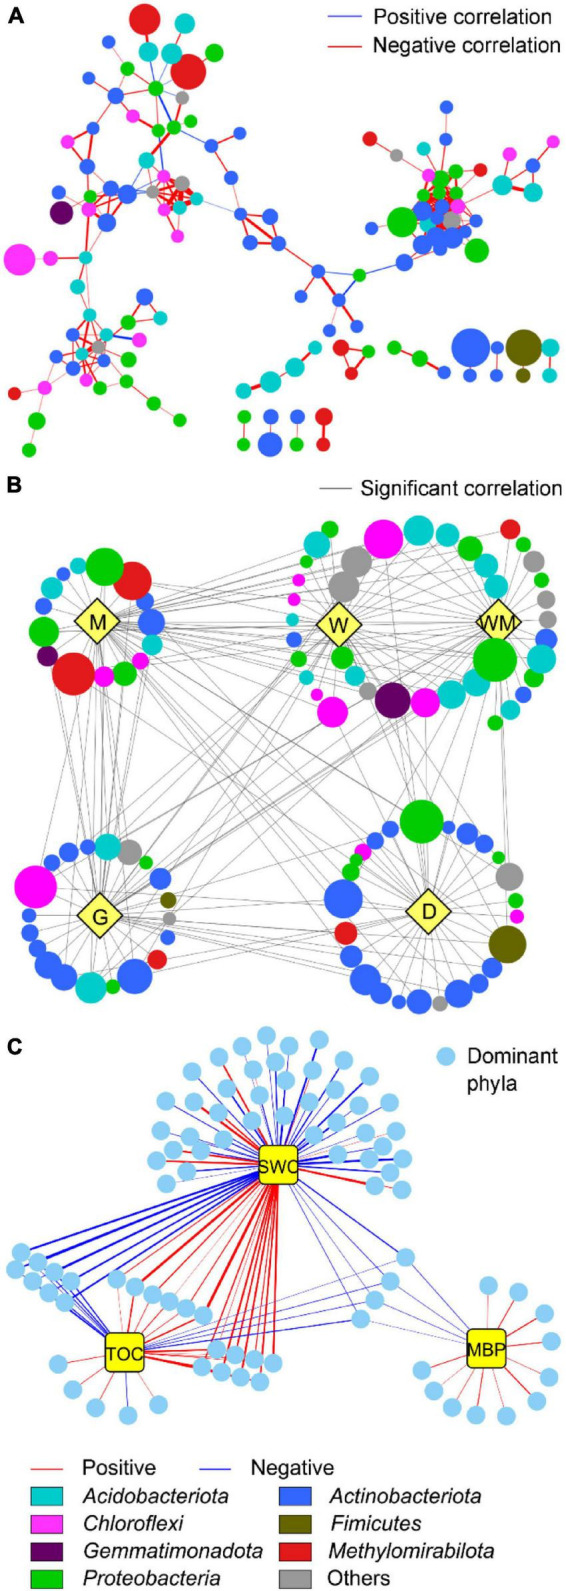
FIGURE 6.

Co-occurrence networks of soil microbial communities across five wetland degradation gradients together (A) and individually (B) and their interactions with soil physicochemical properties (C). The network can be organized into five groups according to the occurrence of different taxa in different gradients (indicated with yellow nodes in (B): typical wetland (W), wet meadow (WM), meadow (M), grassland (G), and desert (D). Gray edges in (B) indicate co-occurrence of taxa in different degradation gradient groups. Nodes are colored by different dominant phyla in (A,B). Yellow nodes in (C) indicate soil properties, including soil water content (SWC), total organic carbon (TOC), and microbial biomass P (MBP).
