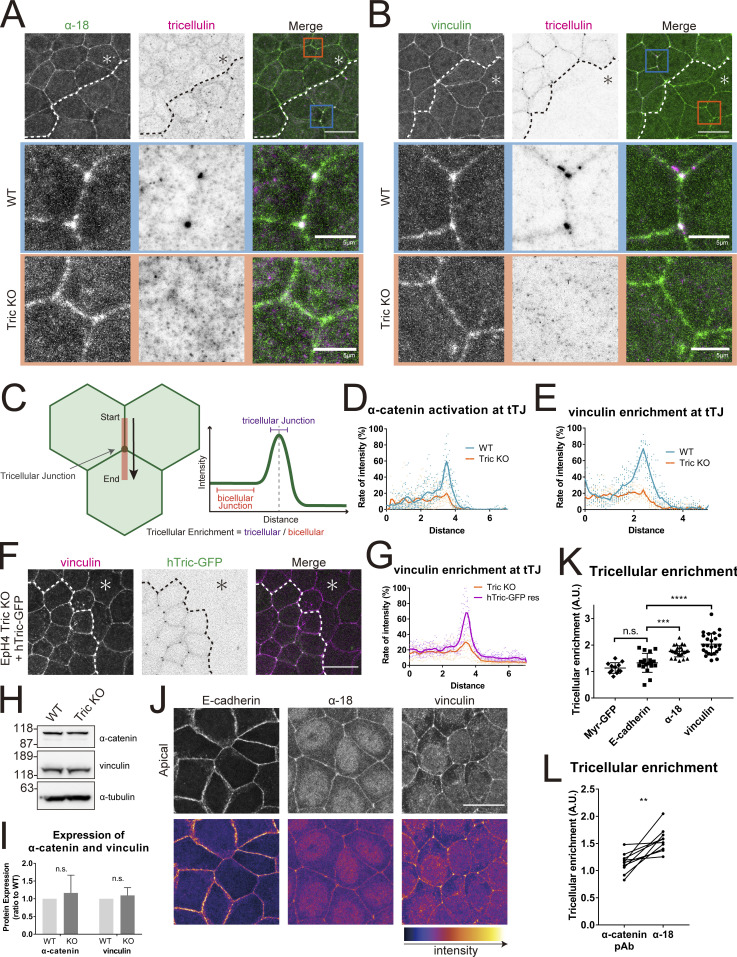
Figure 5.
α-catenin and vinculin are recruited to tTJs in a tricellulin-dependent manner. (A and B) Immunofluorescence images showing anti–α-catenin mAb (α18; green) and anti-tricellulin pAb (N450, magenta; A) or anti-vinculin mAb (green) and anti-tricellulin mAb (magenta; B) staining in a co-culture of WT and Tric KO EpH4 cells. Dotted line overlays the border between WT and Tric KO cells, which are indicated by the asterisk. Tricellular junctions of WT and Tric KO cells are enlarged in the middle and bottom rows, respectively. Scale bar: 20 μm. (C) Schematic showing the method for quantifying protein enrichment at tricellular junctions. A line scan was performed extending from bTJ across tTJ based on the respective immunofluorescence image. The value of tricellular enrichment was calculated by dividing the average intensity value of the tricellular junction by that of the bicellular junction. (D and E) Intensity profiles of α-catenin (D) and vinculin (E) according to the method described in C. Blue line is WT cells, and orange line is Tric KO cells. In both cases, 10 samples were randomly selected. (F) Tric KO EpH4 cells and hTric-cGFP-rescued EpH4 cells were co-cultured and stained with anti-vinculin mAb (magenta). Dotted line overlays the border between Tric KO cells, which are indicated by the asterisk, and hTric-cGFP res EpH4 cells. Scale bar: 20 μm. (G) Intensity profiles of vinculin according to the method described in C. Orange line is Tric KO cells, and purple line is hTric-cGFP res cells. 10 samples were randomly selected. (H) Expression levels of α-catenin and vinculin in WT and Tric KO EpH4 cells were assessed by immunoblotting. Molecular weight measurements are in kD. (I) Quantification of H. Expression levels were corrected for total protein as determined by α-tubulin. n = 3; Student’s t test; ns, P > 0.05. (J) Immunofluorescence images showing anti–E-cadherin mAb, anti–α-catenin mAb (α18), or anti-vinculin mAb staining in EpH4 WT cells. Scale bar: 20 μm. (K) Enrichment of proteins stained in I to tricellular junctions was quantified. Line scan analysis was performed as described in C, and tricellular enrichment was calculated. One-way ANOVA with Tukey’s post hoc analysis, ns, P > 0.05; ***, P < 0.005; ****, P < 0.001. (L) WT EpH4 cells were stained with α-catenin pAb and α-catenin mAb (α18), and their tricellular enrichment was determined as described in C. Lines connect the values acquired at the same line scan. Student’s t test; **, P < 0.01. A.U., arbitrary unit. Source data are available for this figure: SourceData F5.

