Figure 7.
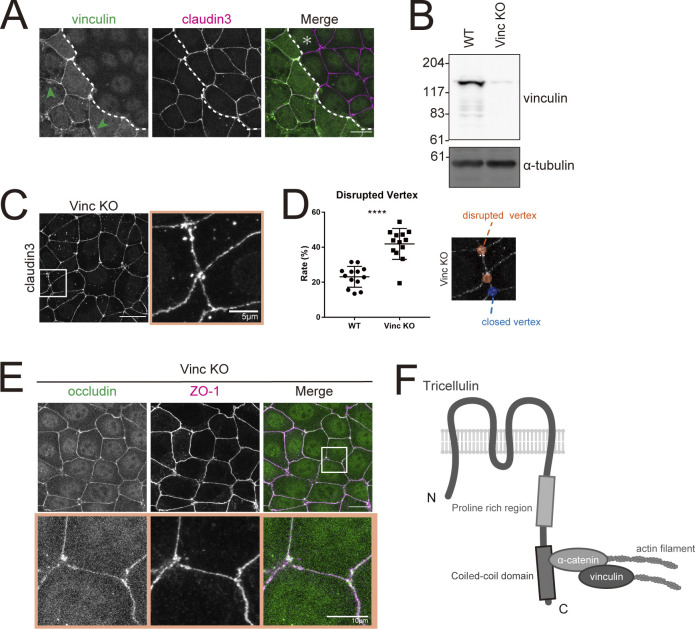
Loss of vinculin leads to impairment of tTJ organization. (A) Immunofluorescence images showing anti-vinculin mAb (green) and anti–claudin-3 pAb (magenta) staining in a co-culture of WT and Vinc KO EpH4 cells. Dotted line overlays the border between WT and Vinc KO cells, which are indicated by the asterisk. Green arrowheads indicate vinculin localized at focal adhesions. Scale bar: 20 μm. (B) Whole-cell lysates of WT and Vinc KO EpH4 cells were immunoblotted with the indicated antibodies. Molecular weight measurements are in kD. (C) Vinc KO EpH4 cells were stained with the anti–claudin-3 pAb. Boxed region is shown at right. Scale bar: 20 μm. (D) The rate of tTJ disruption was quantified as in Fig. 1 D. Student’s t test; ****, P < 0.001. (E) Vinc KO EpH4 cells were costained with anti-occludin mAb (green) and anti–ZO-1 mAb (magenta). Boxed regions are magnified below. Scale bar: 20 μm. (F) Schematic of tricellulin, α-catenin, and vinculin in complex at tricellular junctions. Source data are available for this figure: SourceData F7.

