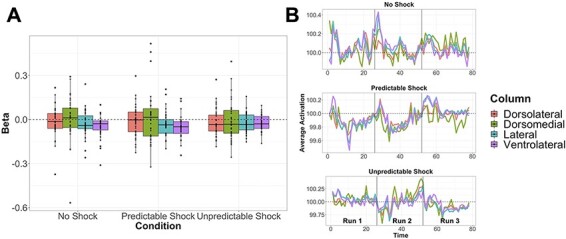
Fig. 6.

(A) Average activation (beta) by condition and PAG column. Black dots represent individuals, boxplots designate mean values and interquartile ranges. Results of repeated measures ANOVAs show the dorsolateral column had greater activation than ventrolateral during P blocks, and a marginal effect within the ventrolateral column such that there was greater activation during U compared to P blocks. (B) Average time series of activation by column for each condition. All runs are concatenated separated by vertical black lines. Time series plots show no clear differentiation in PAG activation by condition.
