
Fig. 2.
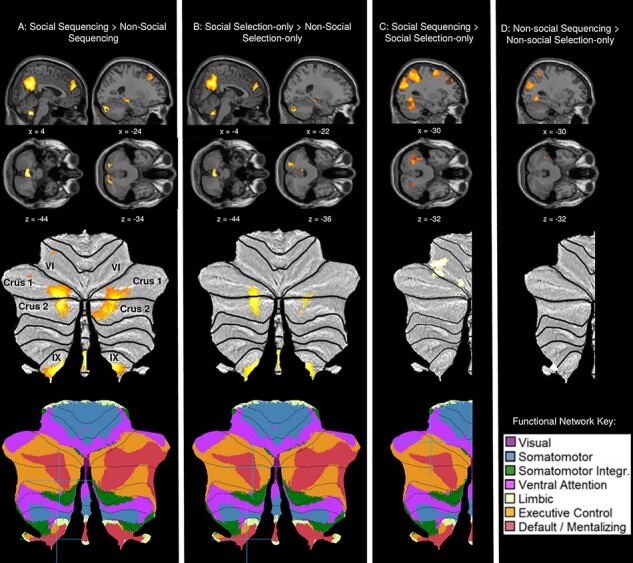
Sagittal and transverse views of the experimental contrasts involving sequencing and selection-only conditions, visualized at a whole-brain uncorrected threshold of P < 0.001, together with visualization on SUIT flatmaps of the cerebellum (with labeling of cerebellar lobules in panel (A). (A) Social sequencing > non-social sequencing contrast and (B) social selection-only > non-social selection-only contrast, both showing significant clusters (P < 0.05, FWE corrected) in cerebellar crus 1 and crus 2, as well as cerebellar lobule IX. (C) Social sequencing > social selection-only contrast showing activation in cerebellar crus 1 using a small volume correction. (D) Non-social sequencing > non-social selection-only contrast, showing no cerebellar activation. Peak activations of significant contrasts are also indicated with a blue crosshair on functional network flatmaps from Buckner et al. (2011; http://www.diedrichsenlab.org/imaging/AtlasViewer/viewer.html).