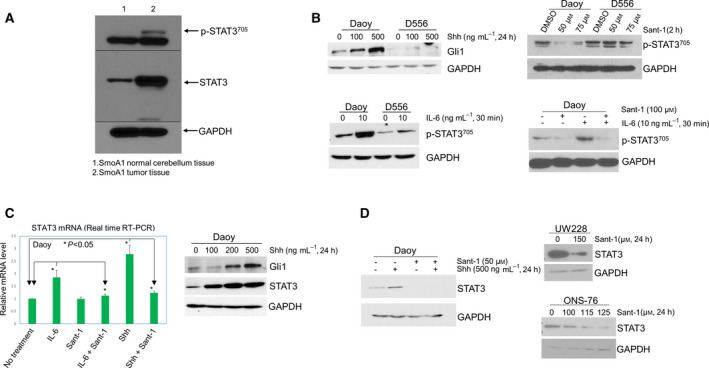
Fig. 1.

STAT3 activation and expression in Shh MB cells are Smo‐dependent. (A) western blot of p‐STAT3705 and total STAT3 in normal cerebellum tissue and tumor tissue from SmoA1 mice. (B) Upper left panel: Gli1 in Daoy and D556 cells after Shh treatment; upper right panel: western blot showing the effect of Sant‐1 treatment on p‐STAT3705 in Daoy and D556 cells; bottom left panel: IL‐6‐induced expression of p‐STAT3705 in Daoy and D556 cells; bottom right panel: Sant‐1 blocked IL‐6‐induced p‐STAT3705 in Daoy cells. (C) Left panel: quantitative real‐time RT‐PCR for expression of STAT3 mRNA. Daoy cells were treated with IL‐6 (20 ng·mL−1) or Shh (500 ng·mL−1) for 6 h; then, total RNA was extracted from the cells for PCR, at least in triplicate for each sample for each PCR. The relative amount of STAT3 mRNA was increased 1.85‐fold by IL‐6, or 2.78‐fold by Shh, compared with the untreated cells, P < 0.05, respectively. Sant‐1(75 µm) significantly blocked IL‐6 or Shh‐induced STAT3 mRNA. Data are presented as mean ± SEM (n = 3); t‐tests were used to determine the significance; right panel: western blot of Gli1 and STAT3 increased following Shh treatment at different doses. (D) Western blot of Shh induced increase of STAT3 protein blocked by Sant‐1 in Daoy cells (left panel); Sant‐1 treatment inhibited expression of STAT3 protein in UW228 and ONS‐76 cells (right panels). All western blot results shown in this figure are representative of at least three independent experiments.
