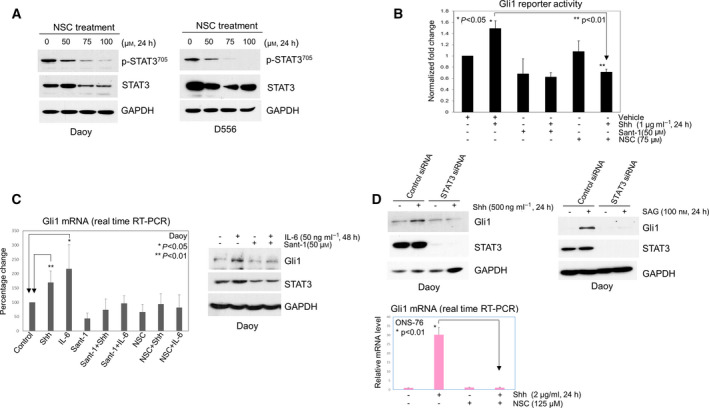
Fig. 2.

Smo‐mediated Shh signaling in Shh MB cells is reciprocally dependent on STAT3. (A) Western blot showing NSC74859 (NSC) treatment abolishes expression of p‐STAT3 and concomitantly reduces total STAT3 in Daoy and D556 cells. (B) Gli1 reporter assays were performed to determine relative Gli1 reporter activity in Shh Light II cells; each treatment was set in triplicate. The cells were treated with vehicle or Shh alone, or Shh combined with Sant‐1 or NSC74859 for 24 h. Shh alone significantly increased Gli1 reporter activity (1.5‐fold, P < 0.05), but NSC74859 treatment significantly decreased Shh‐induced Gli1 reporter activity, only 0.7‐fold, compared with the untreated cells, significantly lower than in the cells with Shh treatment alone (P < 0.01). Data are presented as mean ± SD; t‐tests were used to determine the significance. Results shown are representative of at least three independent experiments. (C) Left panel: Expression of Gli1 mRNA was examined by RT‐PCR in Daoy cells. Shh treatment (500 ng·mL−1, 6 h) alone significantly increased relative Gli1mRNA expression, 1.7‐fold higher than untreated group (P < 0.01). IL‐6 treatment (50 ng·mL−1, 6 h) alone increased Gli1 mRNA 2.2‐fold, significantly higher than control treatment (P < 0.05), and Shh‐induced or IL‐6‐induced Gli1 mRNA was completely blocked by Sant‐1(100 µm) or NSC74859 (100 µm). Data are presented as mean ± SEM (n = 6); t‐tests were used to determine the significance; right panel: western blot showing IL‐6 increased expression of Gli1 and STAT3 protein in Daoy cells and blocked by Sant‐1 treatment. (D) Upper panels: Daoy cells were first transfected with control siRNA or STAT3 siRNA, then treated with vehicle, or Shh or SAG (activator of Smo), Gli1 and STAT3 protein were examined by western blot; bottom panel: showing Shh treatment increased Gli1 mRNA 30‐fold in ONS‐76 cells, but NSC74859 completely blocked Shh‐induced Gli1 mRNA (P < 0.01). Data are presented as mean ± SD; t‐test was used to determine the significance. Results shown are representative of at least three independent experiments. All western blot results shown in this figure are representative of at least three independent experiments.
