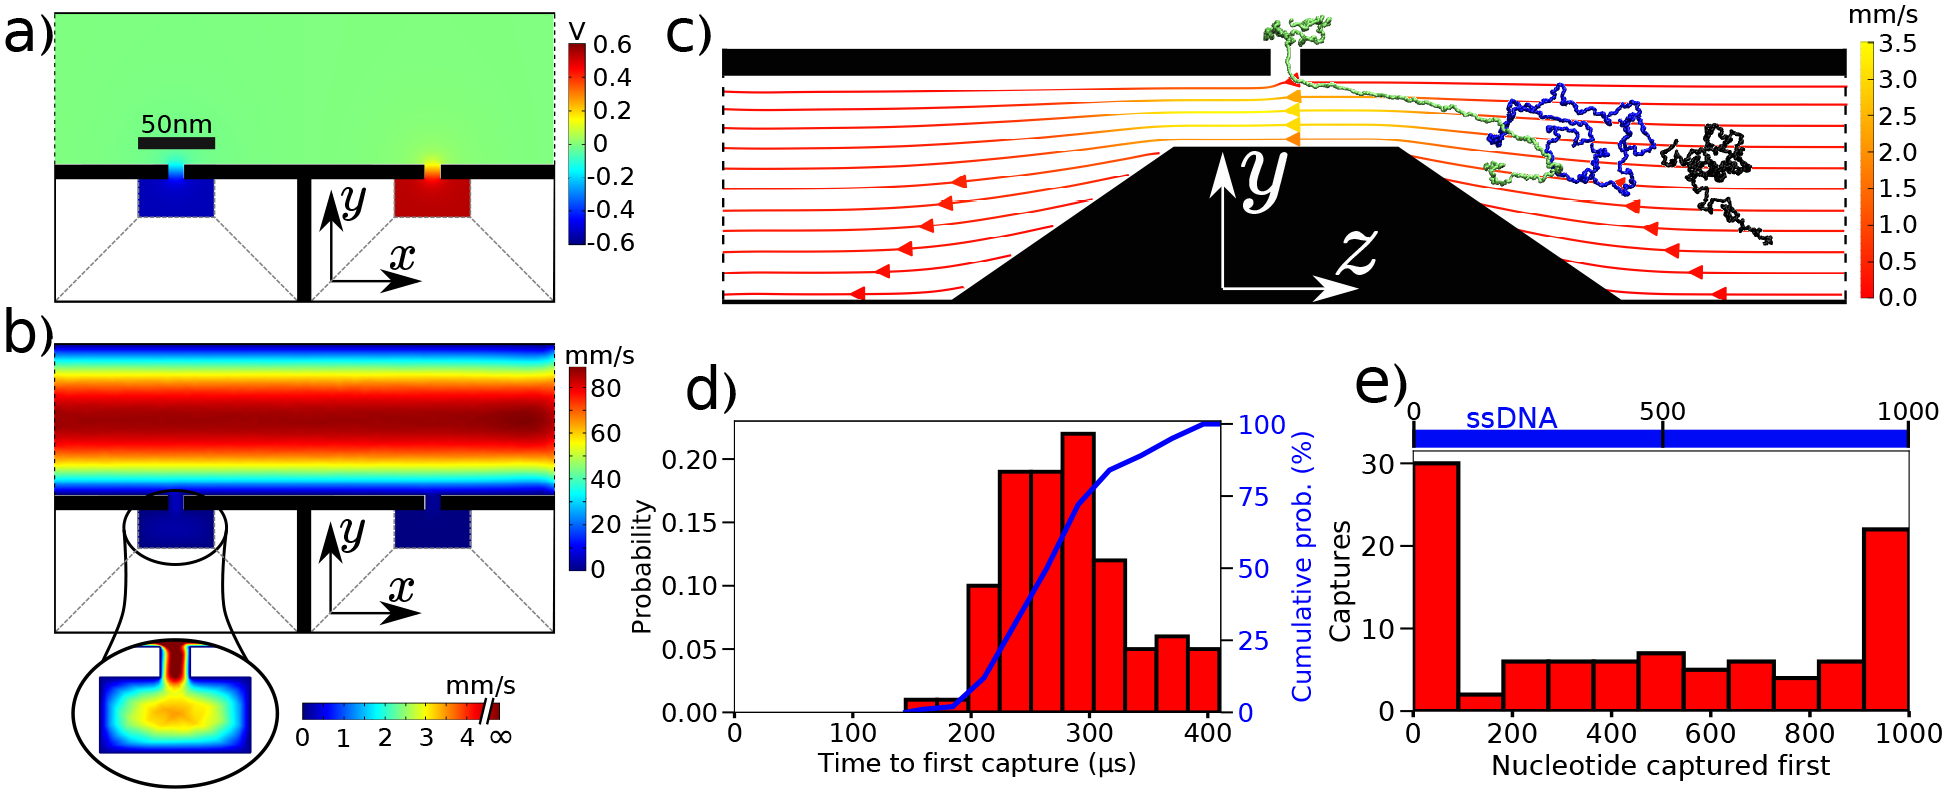
Figure 2:

Statistics of ssDNA capture. (a,b) The electrostatic potential (panel a) and the fluid flow velocity (panel b) in the x-y cross section of the double nanopore system. The cross section passes through the two nanopores. The inset illustrates the fluid flow inside the first delivery channel. (c) Snapshots illustrating typical conformations of ssDNA (at 0 μs, black; 232 μs, blue; and 307 μs, green) during a nanopore capture in the first delivery channel. The streamlines illustrate the local direction and the magnitude of the solvent flow. (d) Normalized distribution of the time elapsed from the start of the simulation until the nanopore capture. The distribution was obtained from the analysis of 100 independent simulations that differed from one another by the initial conformation of ssDNA. The cumulative probability of nanopore capture (plotted at the right axis) reaches 100%, i.e., all 100 molecules were captured. (e) The probability of first ssDNA capture occurring at the specifying site along the DNA molecule.
