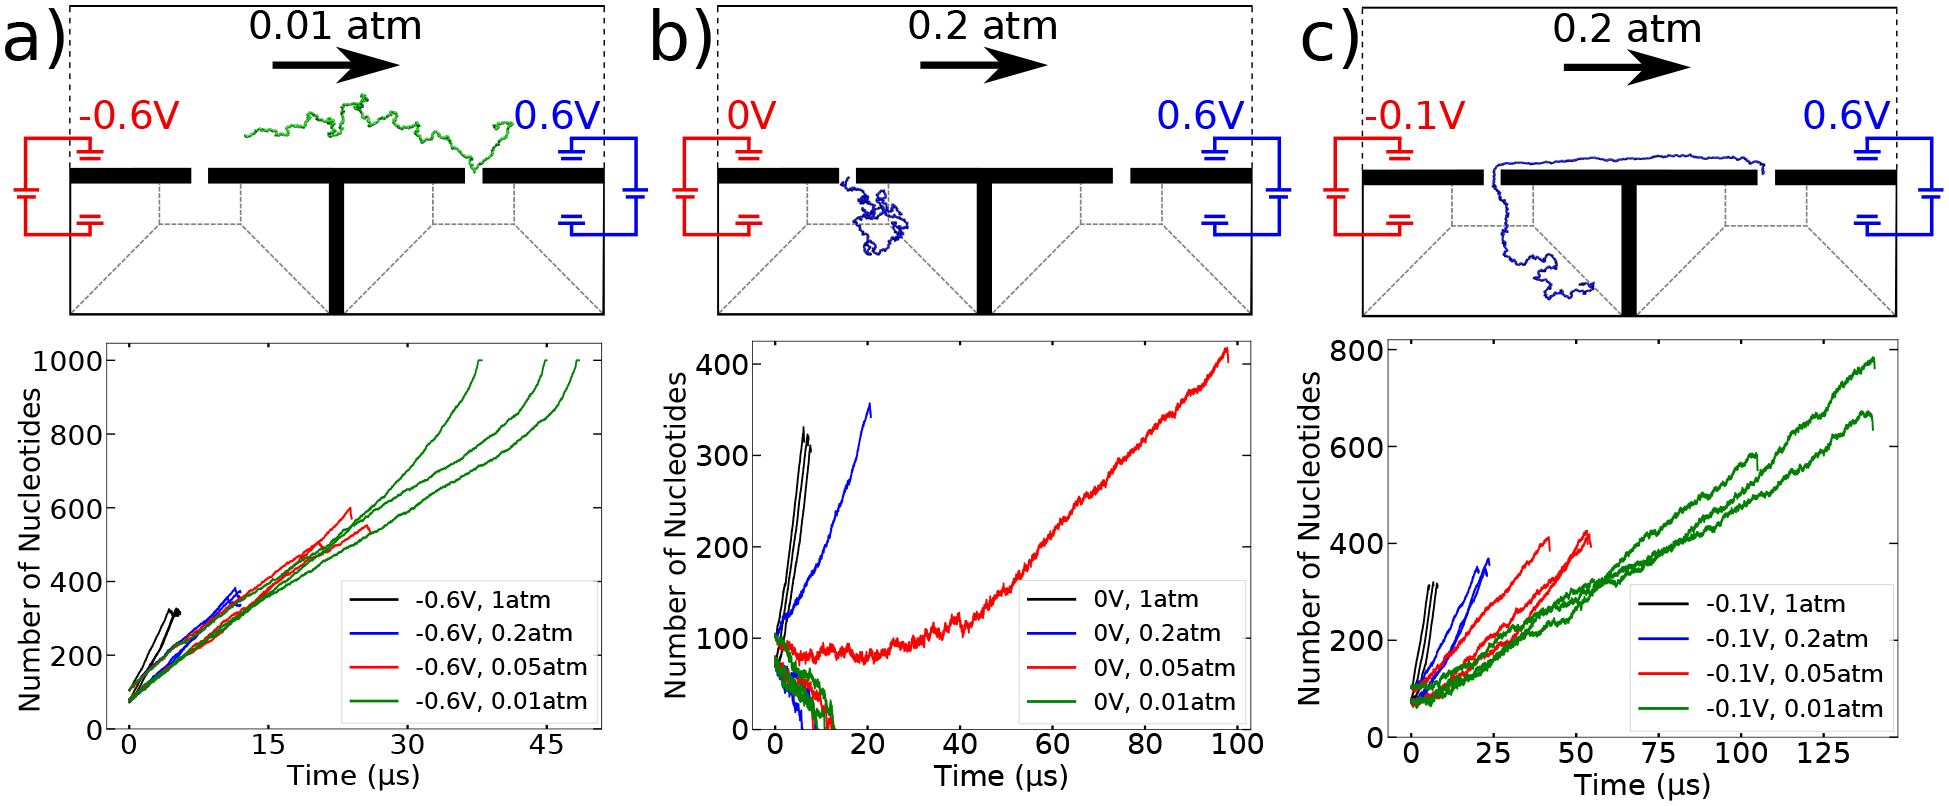
Figure 4:

Conditions affecting second nanopore capture. (a–c) Number of DNA nucleotides in the flow chamber versus simulation time for V1 = −600 (panel a), 0 (panel b) and and −100 (panel c) mV and the four values of Δpch indicated by the color of the lines. Three independent simulations were carried out for each combination of V1 and Δpch. All simulations started from three different initial configurations of ssDNA each of which was end-threaded through the first nanopore.
