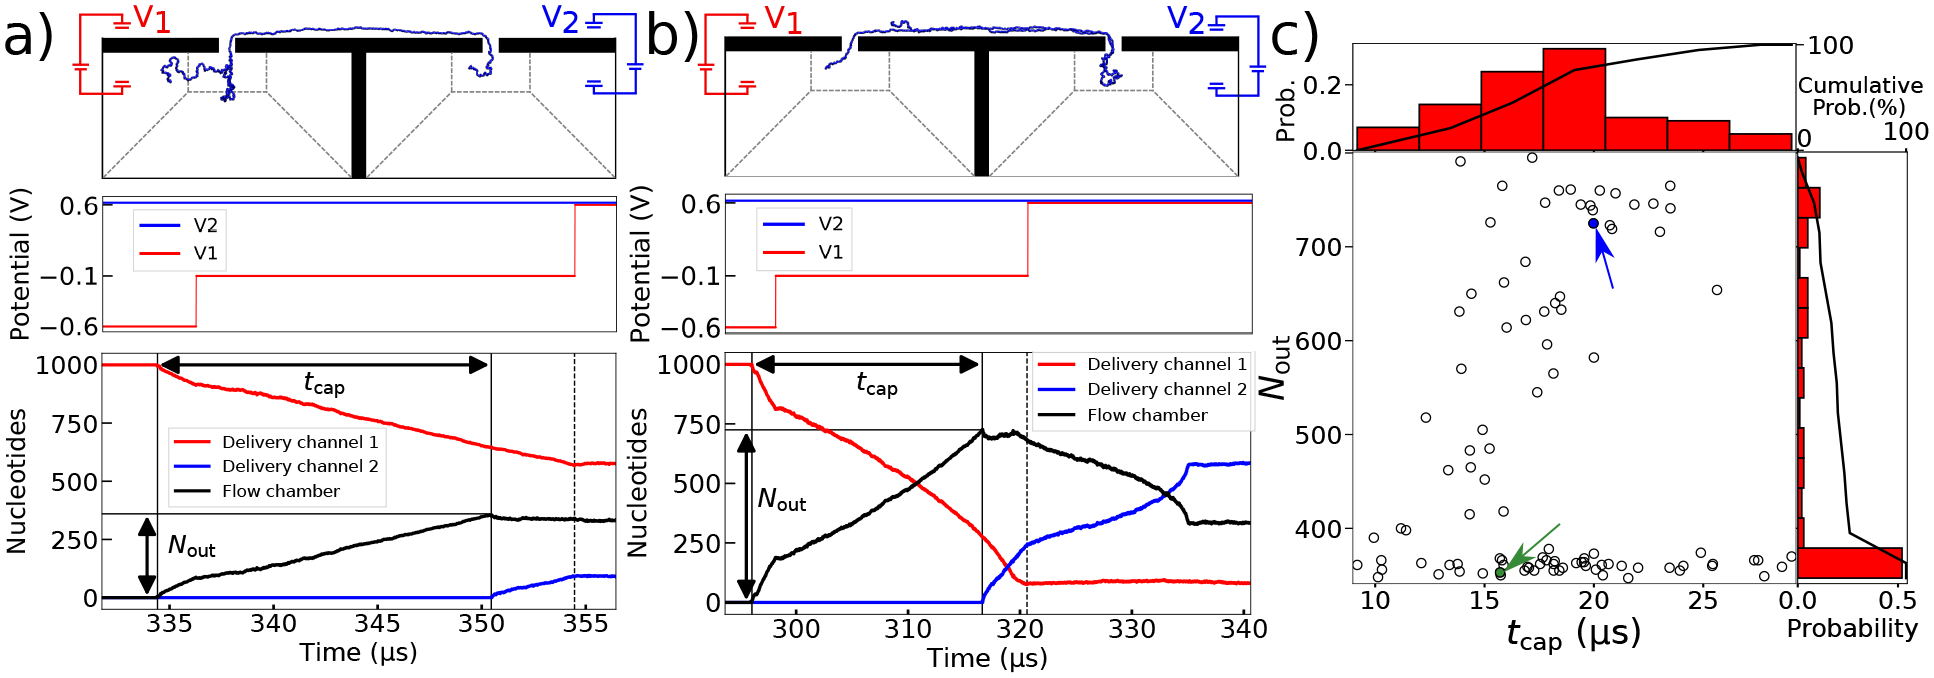
Figure 5:

Statistics of second pore capture. (a,b) The voltage bias (top) and the number of DNA nucleotides in the delivery channels and flow chamber (bottom) versus simulation time for end-threaded capture (panel a) and for folded capture (panel b). The time between captures is denoted by tcap and the number of nucleotides in the flow chamber at the time of second capture, Nout. The images illustrate the DNA conformation 4 μs after second capture, when V1 is changed to 0.6 V. These times are denoted with a dashed line. (c) Scatter plot of Nout versus tcap for all 100 simulations. The simulations marked with green and blue arrows are the ones shown in panel a and b, respectively. The histograms show the distribution of the tcap (top) and Nout (right) values. The cumulative probability of double nanopore capture reaches 100%, i.e., all 100 molecules were simultaneously captured in both nanopores.
