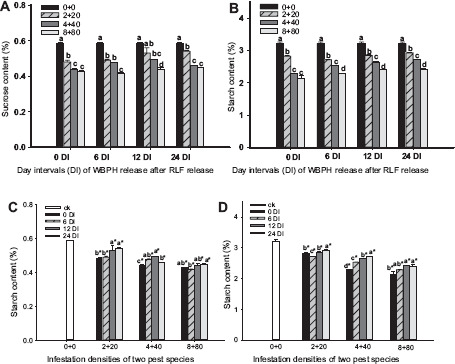
Figure 5.

Effects of the sequential infestation densities of WRARR on the sucrose and starch contents in the rice plants under different DIs. (A) sucrose content, (B) starch content, (C) comparisons of the effects of the DIs on sucrose contents, and (D) comparisons of the effects of the DIs on starch contents. The results are expressed as mean ± SE. Bars with different letters within the same DI (A or B) and within the same infestation density (C or D) represent significant differences at the 5% level. The “*” symbol represents a significant difference between the DI and control (0 + 0) (without insect infestation) at the 5% level.
