
Figure 3. Use of Specific Health Services Over 12 Months Following Randomization.
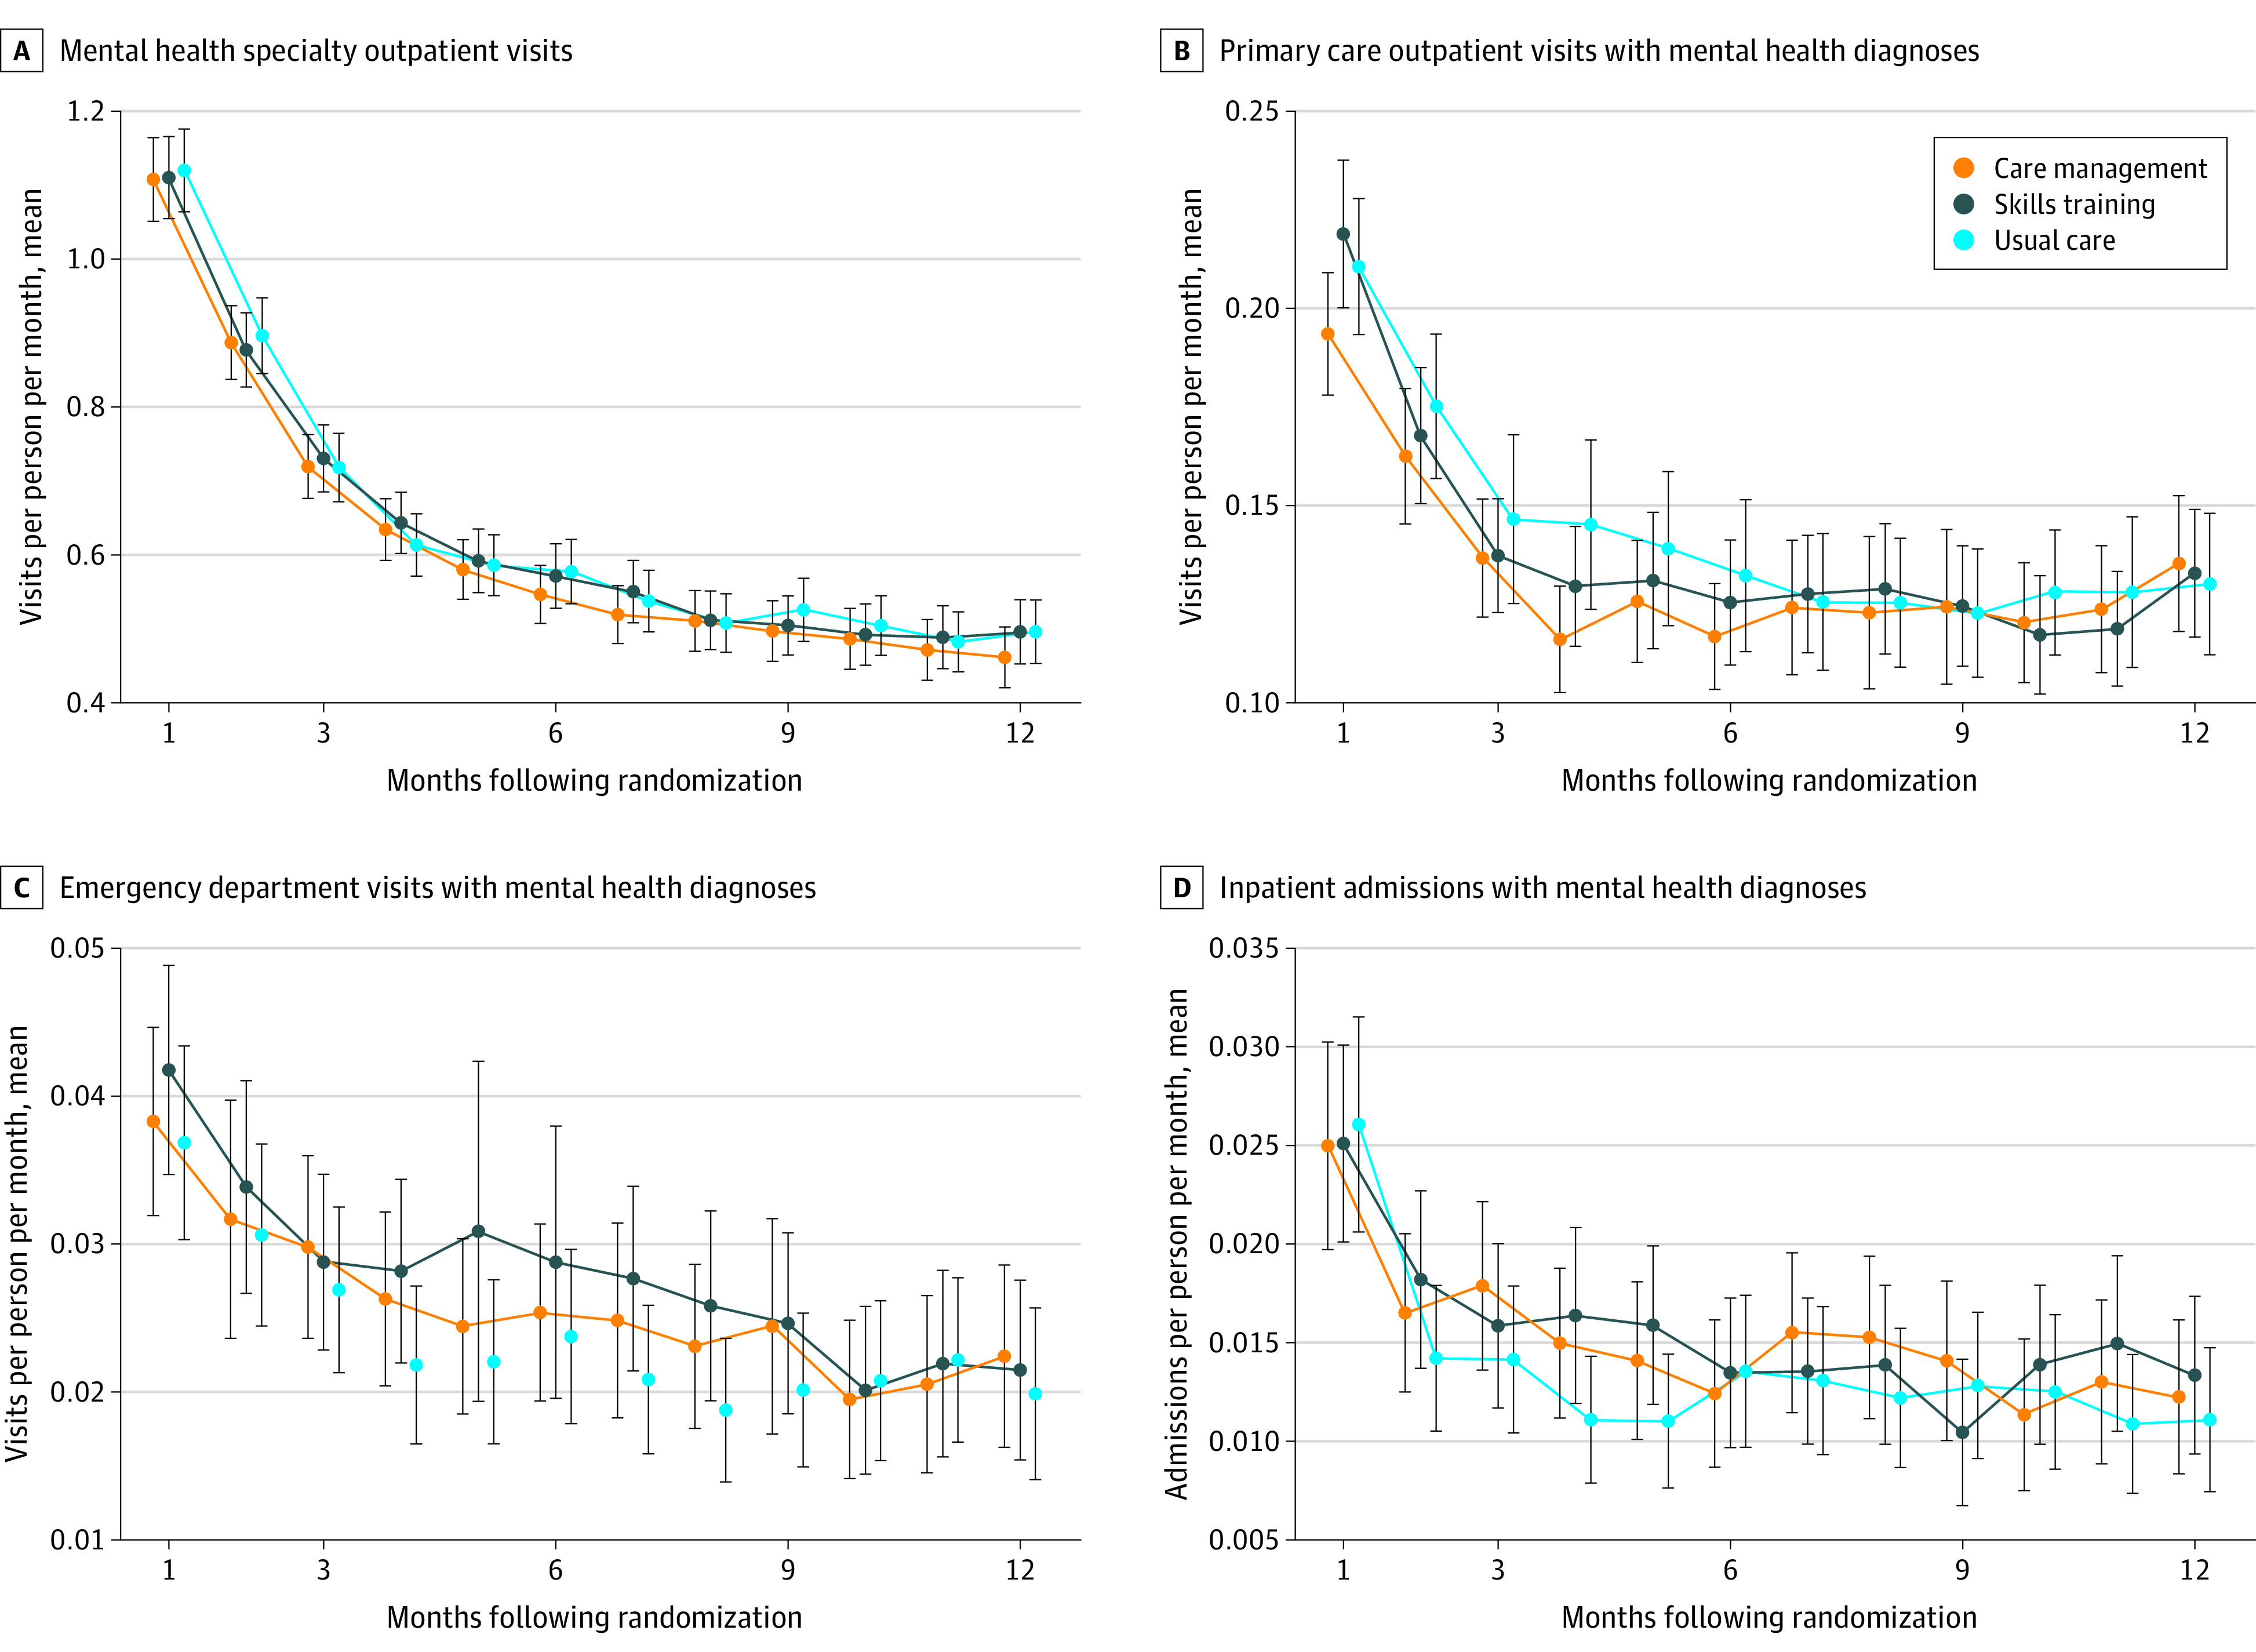
The panels show adjusted mean number of visits or admissions per month, with error bars indicating 97.5% CIs, according to initial randomization. Monthly utilization was modeled as a function of time using generalized estimating equations. Twelve-month utilization was calculated by summing coefficient estimates; the Delta method was used to calculate standard errors. A t statistic was used to compare 12-month utilization in each of the intervention groups with usual care. Mean visits/admissions per person over 12 months were as follows: for mental health specialty outpatient visits (panel A), 7.50 (97.5% CI, 7.05-7.96; P = .63 vs usual care) for care management, 7.65 (97.5% CI, 7.65-8.1; P = .88 vs usual care) for skills training, and 7.62 (97.5% CI, 7.15-8.08) for usual care; for primary care outpatient visits with mental health diagnoses (panel B), 1.35 (97.5% CI, 1.23-1.46; P = .22 vs usual care) for care management, 1.41 (97.5% CI, 1.29-1.52; P = .65 vs usual care) for skills training, and 1.44 (97.5% CI, 1.31-1.57) for usual care; for emergency department visits with mental health diagnoses (panel C), 0.31 (97.5% CI, 0.27-0.35; P = .15 vs usual care) for care management, 0.33 (97.5% CI, 0.28-0.39; P = .02 vs usual care) for skills training; and 0.28 (97.5% CI, 0.24-0.32) for usual care; and for inpatient admissions with mental health diagnoses (panel D), 0.19 (97.5% CI, 0.16-0.21; P = .09 vs usual care) for care management, 0.19 (97.5% CI, 0.16-0.21; P = .05 vs usual care) for skills training, and 0.17 (97.5% CI, 0.14-0.19) for usual care.