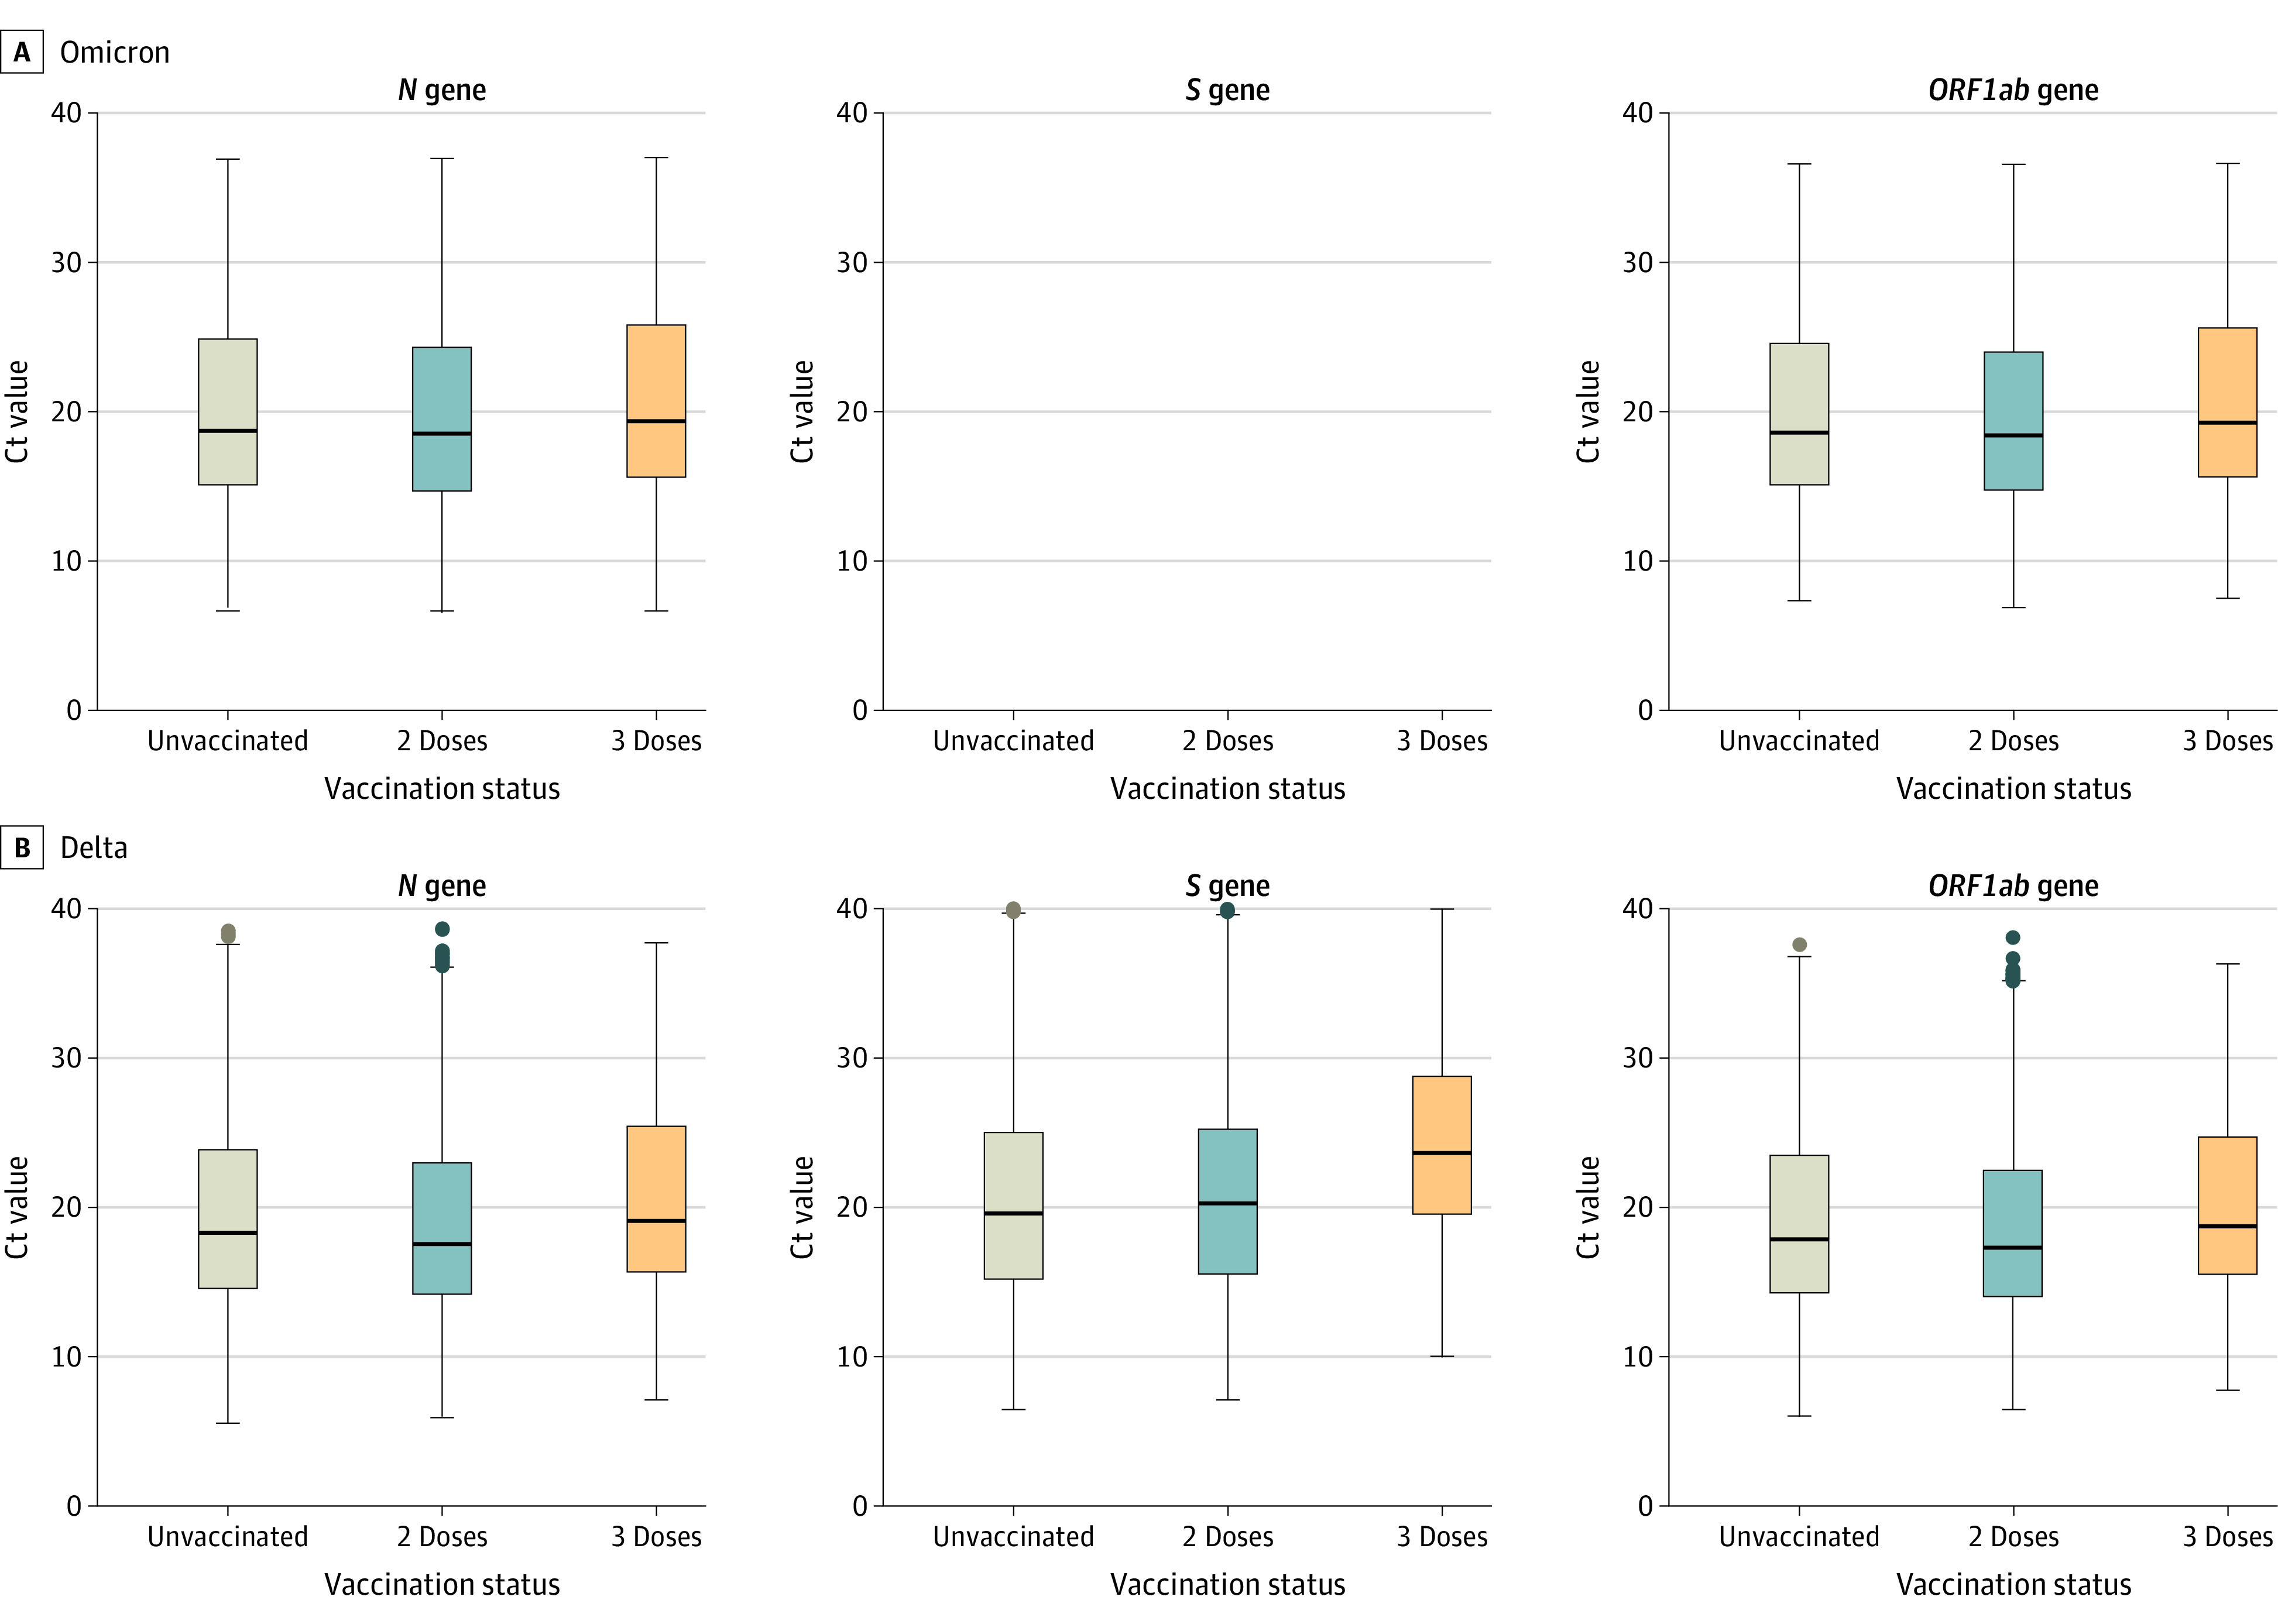
Figure 3. Cycle Threshold Values for the N, ORF1ab, and S Genes by Variant and Vaccination Status Among SARS-CoV-2–Positive Cases Tested by the TaqPath COVID-19 Combo Kit Assay in the Increasing Community Access to Testing Platform, December 10, 2021, to January 1, 2022.

For each plot, from top to bottom, lines in the box represent the 75th percentile, median, and 25th percentile. The whiskers extend to the largest and smallest values up to 1.5 times the interquartile range from the 75th and 25th percentiles, respectively. Data beyond the ends of the whiskers are plotted individually. Unvaccinated (Omicron n = 3412; Delta n = 5044; total n = 8456) were individuals who received zero vaccine doses. Two doses (tested ≥6 months after dose 2) of mRNA vaccine (Omicron n = 7245; Delta n = 4570; total n = 11 815) included vaccination histories BNT162b2/BNT162b2/no third dose, mRNA-1273/mRNA-1273/no third dose, mRNA-1273/BNT162b2/no third dose, and BNT162b2/mRNA-1273/no third dose. Three doses (tested ≥14 days after dose 3, with ≥6 months between doses 2 and 3) of mRNA vaccine (Omicron n = 2441; Delta n = 679; total n = 3120) included vaccination histories BNT162b2/BNT162b2/BNT162b2, mRNA-1273/mRNA-1273/mRNA-1273, BNT162b2/BNT162b2/mRNA-1273, mRNA-1273/mRNA-1273/BNT162b2, mRNA-1273/BNT162b2/BNT162b2, BNT162b2/mRNA-1273/BNT162b2, mRNA-1273/BNT162b2/mRNA-1273, and BNT162b2/mRNA-1273/mRNA-1273. Cycle threshold (Ct) values were compared between 3 doses and unvaccinated, 3 doses and 2 doses, and 2 doses and unvaccinated. Significance testing was performed with a 2-sided Mann-Whitney U test and false-discovery rate–corrected for multiple comparisons. Q < .001 for all comparisons, except for comparing 3 doses vs unvaccinated for N gene for Omicron and for comparing 2 doses vs unvaccinated for the N and ORF1ab genes for Omicron and the S gene for Delta (eTable 2 in the Supplement).
