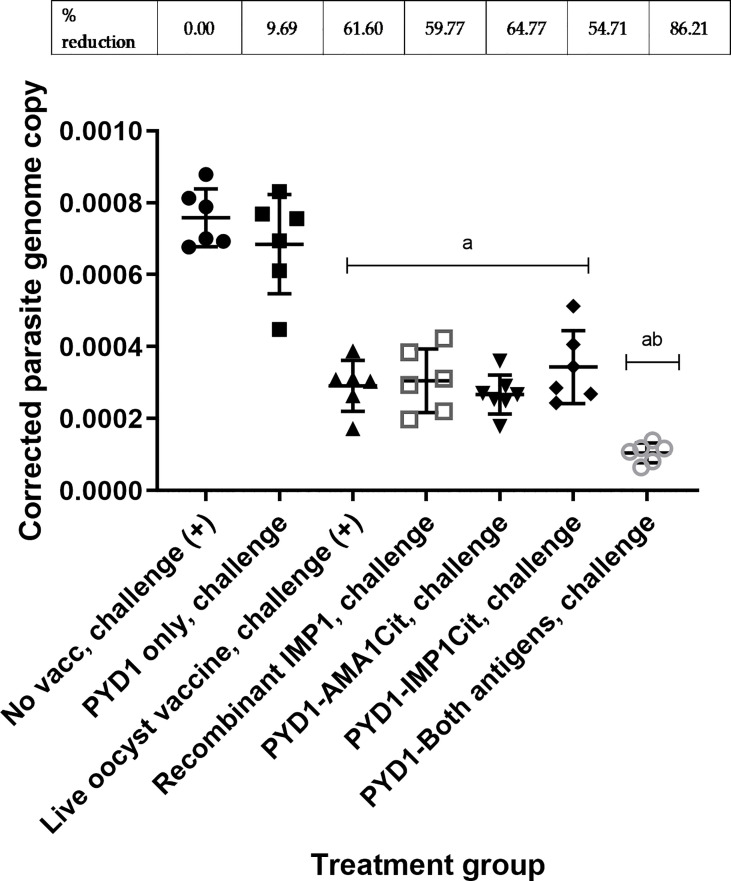
Figure 1.
Eimeria tenella replication assessed by qPCR of genomic DNA extracted from caeca following low dose challenge in Hy-line brown layer chickens (Study 1). Treatment groups are shown on the x-axis and E. tenella genome copy number corrected using chicken TBP copy number is on the y-axis. Each marker represents one chicken (n= 6-8 per group). Mean and standard deviation for each group is shown. Groups with significantly different mean corrected parasite copy number compared with unvaccinated, challenged chicken group are shown with letter a. The group with significantly mean corrected parasite copy number compared with all other groups is shown with letters ab. Percentage reduction in mean corrected parasite copy number compared with unvaccinated, challenged chicken group are shown above graph.

