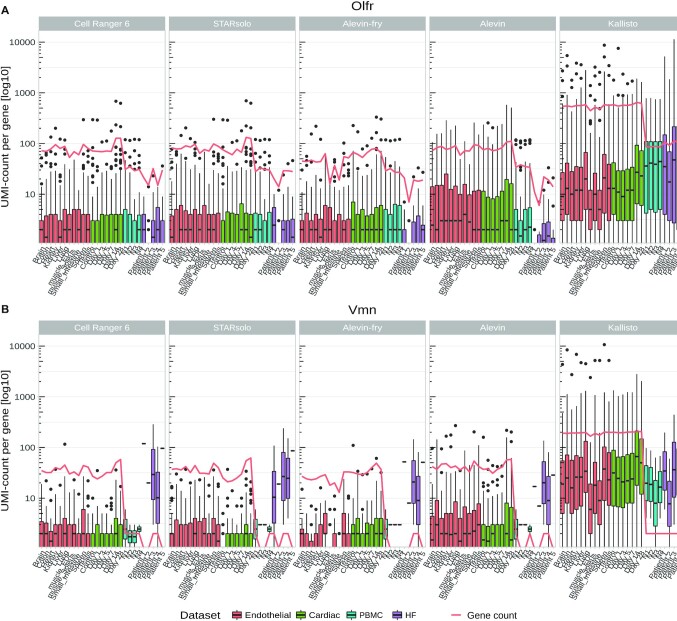
Figure 3:
UMI counts of all detected (A) Vmn (Vomeronasal receptor genes) and (B) Olfr (Olfactory receptor genes) genes per mapper in each sample. The red line indicates the total number of expressed genes in the gene families. Boxes indicate the 25th and 75th percentiles and whiskers indicate maximal and minimal values.

