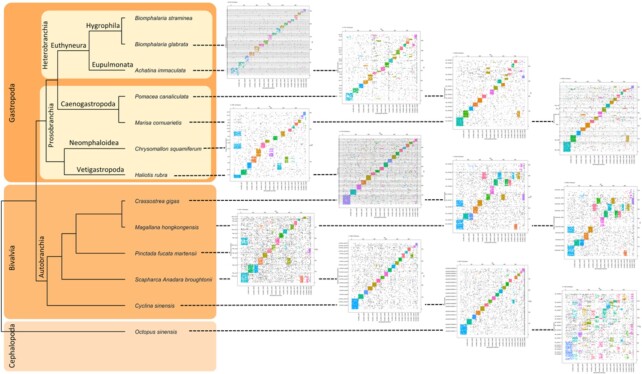
Figure 4.
: Synteny between B. straminea and 12 mollusc genomes. The species tree is constructed using 2,047 orthogroups with ≥12 of 13 mollusc genomes having single-copy genes in each orthogroup. In the Oxford dot plot, each dot represents a pair of orthologous genes between B. straminea and the specific mollusc. Horizontal and vertical dashed lines represent chromosome or scaffold boundaries. Orthologous genes are coloured according to their position in B. straminea scaffolds. Significance of synteny blocks is computed using 1-tailed Fisher exact test, and synteny blocks with Benjamini & Hochberg–corrected P > 0.05 are indicated in grey.

