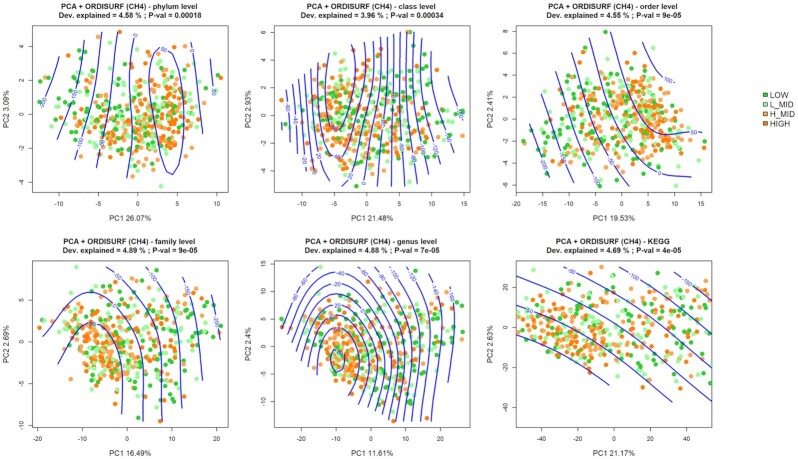
Figure 3:
Fitted surface representation of principal component analysis. Dots represent the samples using Euclidean distances of CLR-transformed taxa abundances, coloured by CH4 levels. CH4 emissions (ppm) corrected by number and stage of lactation are represented as smooth fitting following a generalized additive model (GAM) (green). Dev. Explained: variability explained by GAM; P-val: approximate significance of the smooth terms being 0 (α = 0.05).

