
Figure 1.
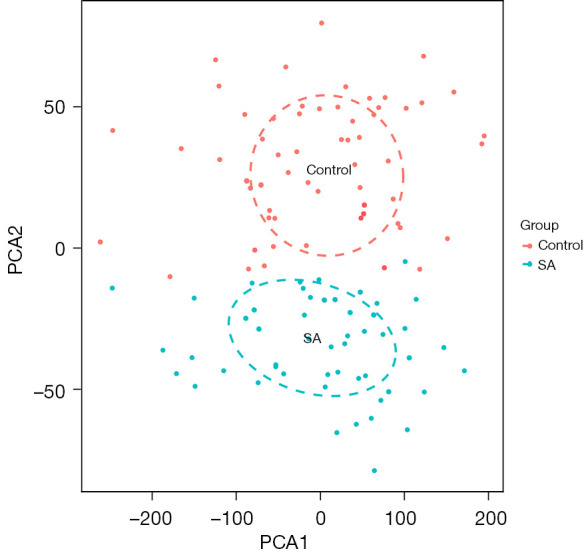
Two-dimensional PCA cluster plot of theGSE83456; blue denotes the Sarcoidosis group, and red denotes the normal group (control). PCA, principal component analysis; SA, sarcoidosis.
Official websites use .gov
A
.gov website belongs to an official
government organization in the United States.
Secure .gov websites use HTTPS
A lock (
) or https:// means you've safely
connected to the .gov website. Share sensitive
information only on official, secure websites.
Two-dimensional PCA cluster plot of theGSE83456; blue denotes the Sarcoidosis group, and red denotes the normal group (control). PCA, principal component analysis; SA, sarcoidosis.